
Figure 2.
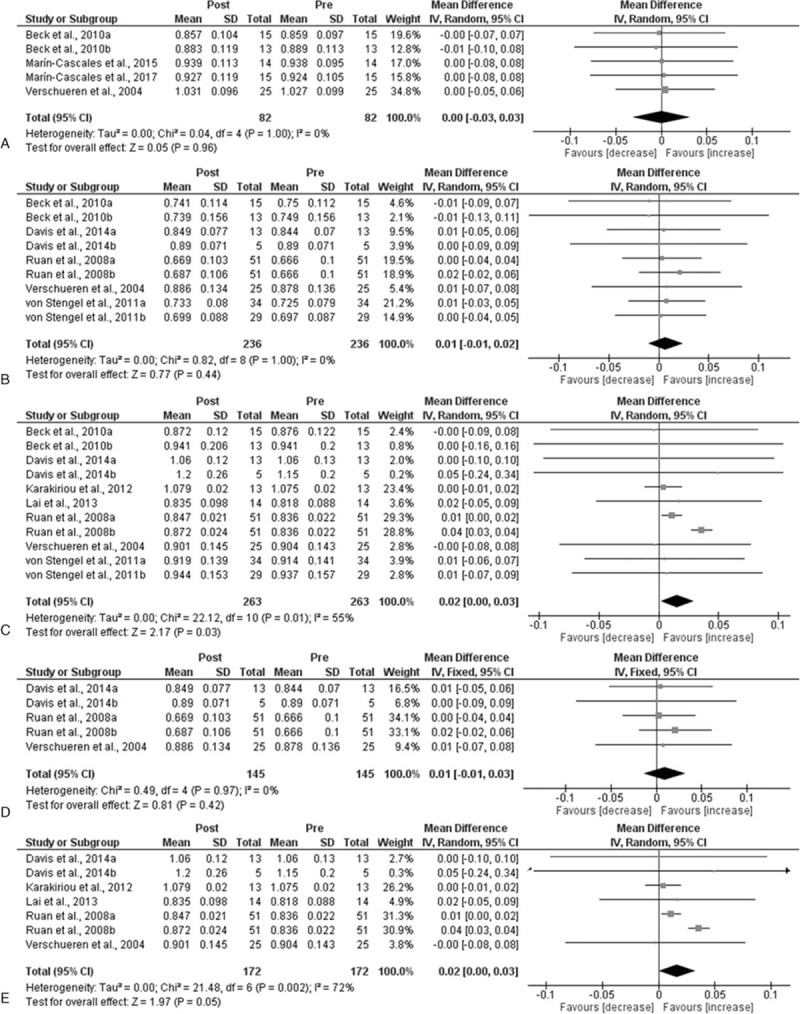
Mean difference (MD) in bone mineral density (BMD) between post- and preintervention. Squares represent the MDa for each trial. Diamonds represent the pooled MD across trials. (A) Total BMD; (B) femoral neck; (C) low back; (D) Femoral neck in postmenopausal women younger than 65 years; and (E) low back in postmenopausal women yonger than 65 years. CI = confidence interval, SD = standard deviation.