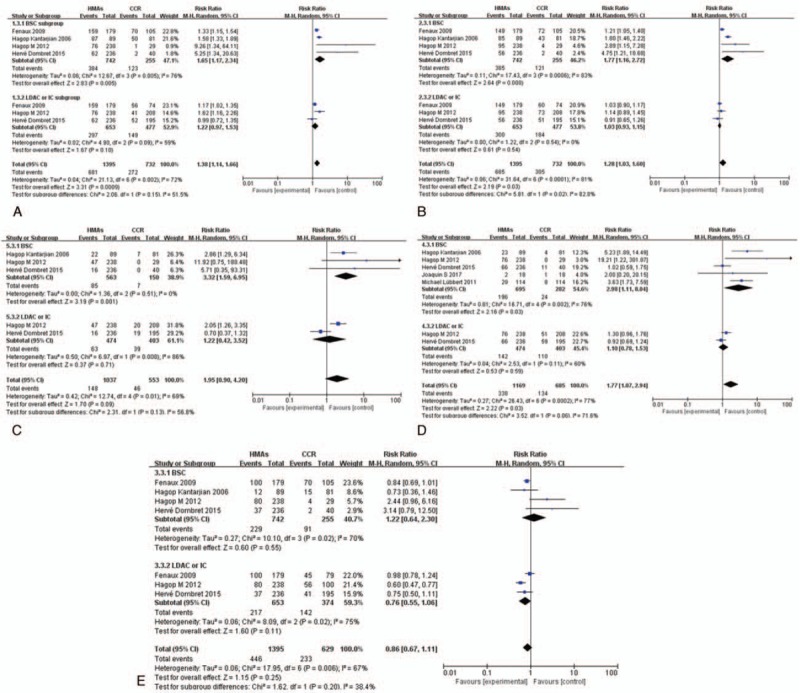
Figure 8.

RR of high-grade HTEs in patients associated with HMAs versus CCR (BSC, IC, and LDAC). (A) Forest plot of RR of high-grade neutropenia. (B) Forest plot of RR of high-grade thrombocytopenia. (C) Forest plot of RR of high-grade leukopenia. (D) Forest plot of RR of high-grade febrile neutropenia. (E) Forest plot of RR of high-grade anemia (sub-grouped by the type of CCR). BSC = best supportive care, CCR = conventional care regimens, HMAs = hypomethylating agents, HTEs = hematologic toxicity effects, IC = intensive chemotherapy, LDAC = low-dose cytarabine, RR = relative risks.
