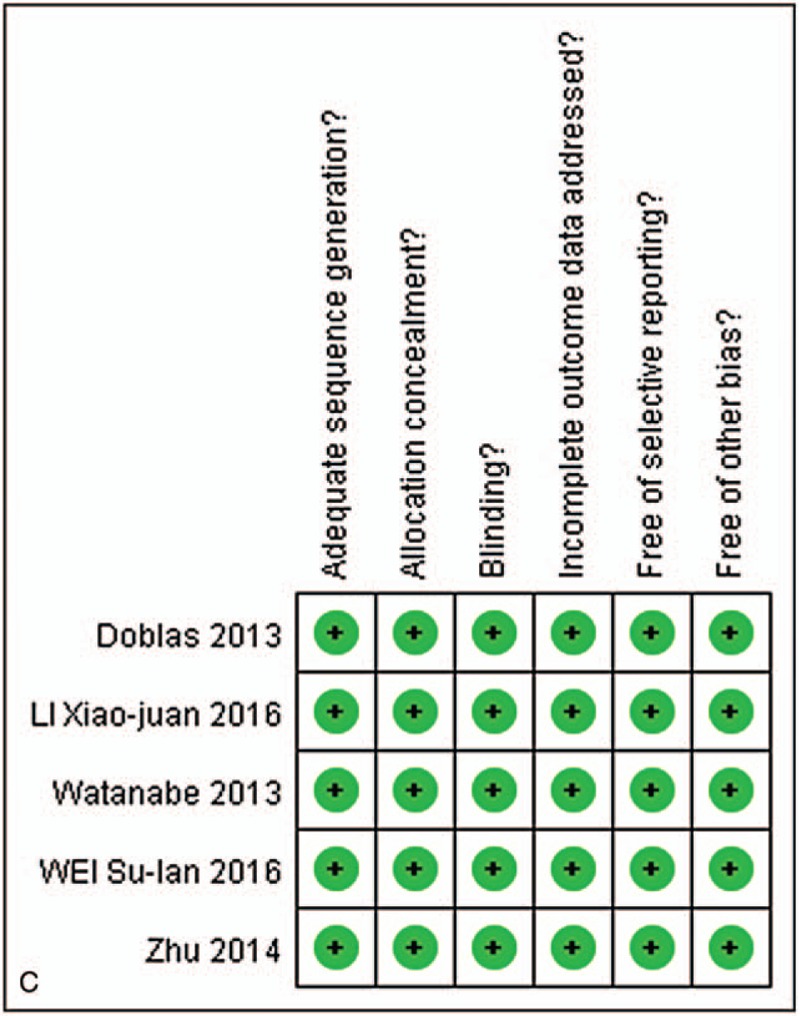
Figure 1 (Continued).

A, Study selection process. The flowchart summarizes the selection of studies including numbers and reasons of exclusion. B, Risk of bias graph: review authors’ judgments about each risk of bias item presented as percentages across all included studies. C, Risk of bias summary: review authors’ judgments about each risk of bias item for each included study.
