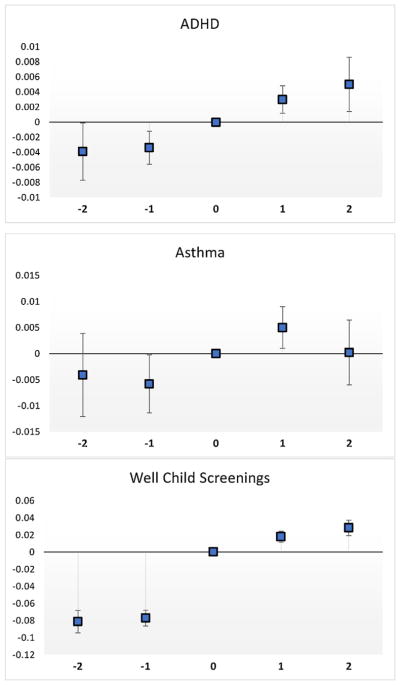
Fig. 6.
Event study Graphs.
Notes: These graphs are constructed using point estimates and confidence intervals from regressions for each outcome with county FEs, year FEs, and all available controls for the individuals who switched from FFS to MMC in 2007 or later and remained in the sample for at least 2 years prior to the switch and post-switch. There are 409,230 observations.

