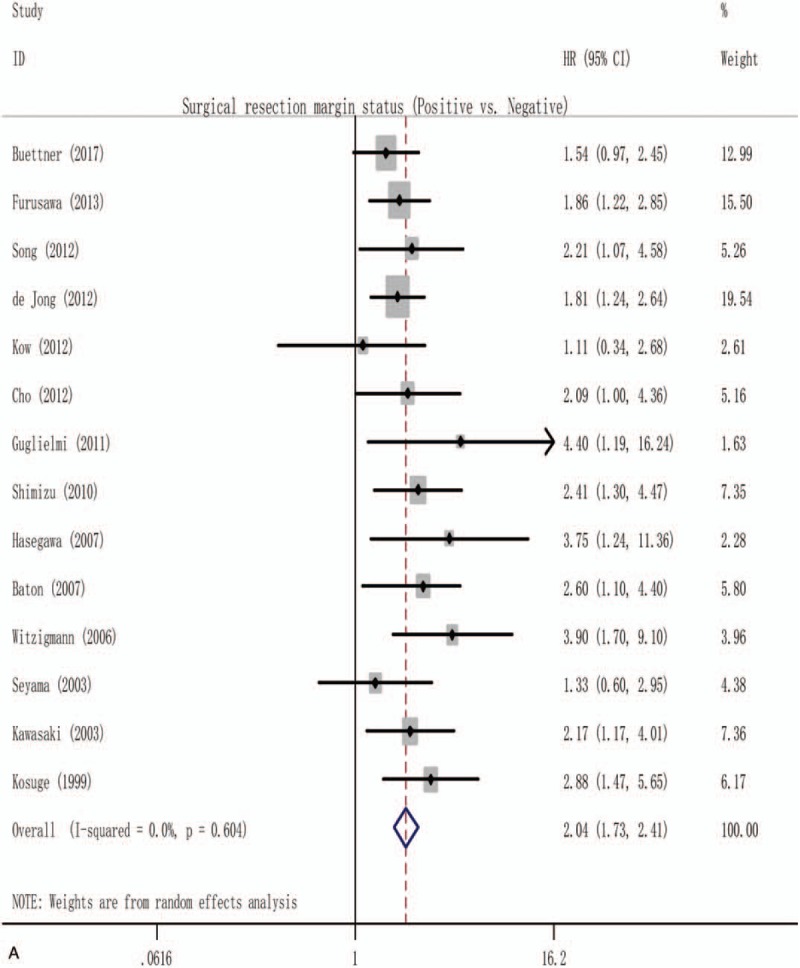
Figure 2.

Forest plot for the pooled analysis the association of clinicopathological factors with overall survival of resectable perihilar cholangiocarcinoma. (A) Forest plot for the pooled analysis of surgical resection margins status. (B) Forest plot for the pooled analysis of lymph node status (positive vs negative). (C) Forest plot for the A pooled analysis of histological grade (poor or moderate vs well). (D) Forest plot for the pooled analysis of T-stage (T3 and/or T4 vs T1 and/or T2). (E) Forest plot for the pooled analysis of gender of participation (male vs female). (F) Forest plot for the pooled analysis of operative transfusion (yes vs no).
