
Figure 5.
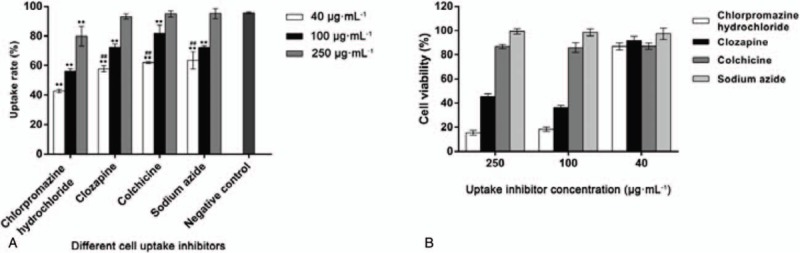
Mechanism of cellular uptake. (A) Flow cytometry results with different cellular uptake inhibitors. ∗∗P < .01 (n = 3), compared with negative control. Inhibitor concentration, 40 μg mL−1; ##P < .01 (n = 3), compared with chlorpromazine hydrochloride. (B) In vitro cytotoxicity of different cellular uptake inhibitors (incubation time 30 minutes).