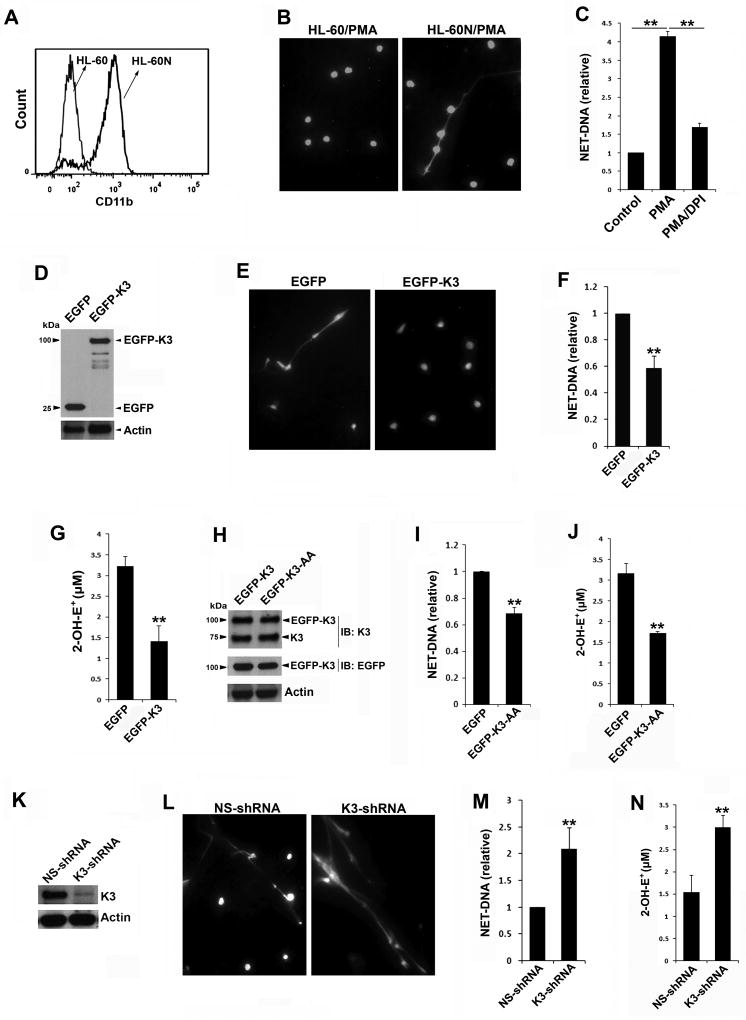
Figure 1.
Kindlin-3 inhibits the generation of ROS/NETs in neutrophil-like HL-60 (HL-60N) cells. (A) FACS histograms to show the expression levels of CD11b in undifferentiated HL-60 and differentiated HL-60N cells. (B) HL-60 and HL-60N cells were resided on chamber slides and stimulated with PMA (100 nM) for 2 hours, and fixed, permeabilized and stained with Hoechst to display the NET-DNA fibers under a fluorescence microscope (10× objective). (C) The HL-60N cells were stimulated with PMA (100 nM) for 2 hours in the presence or absence of DPI (10 µM). HL-60N cells without PMA stimulation were used as a control. NET-DNA released from these cells was quantified by SYTOX green. (D) Western blots to show the expression of EGFP and EGFP-kindlin-3 (EGFP-K3) in HL-60N cells. (E) As described in (B), HL-60N cells expressing either EGFP or EGFP-K3 were stained with Hoechst after PMA stimulation. (10× objective) (F) HL-60N cells expressing either EGFP or EGFP-K3 were stimulated with PMA and NET-DNA released from these cells was quantified by SYTOX green. (G) HL-60N cells expressing either EGFP or EGFP-K3 were stimulated with PMA (100 nM) in the presence of hydroethidine (HE, 20 µM). The oxidation of HE were evaluated by the production of 2-OH-E+ using a HPLC-based assay. (H) Western blots to show the expression levels of endogenous kindlin-3, and EGFP-K3 with or without the QW/AA mutations (K3-AA) in HL-60N cells. (I) HL-60N cells expressing either EGFP or EGFP-K3-AA were stimulated with PMA (100 nM) and NET-DNA release was quantified by SYTOX green. (J) HL-60N cells expressing either EGFP or EGFP-K3-AA were stimulated with PMA (100 nM) in the presence of HE for 60 minutes. The production of 2-OH-E+ was measured. (K) Western blots to show the expression of endogenous kindlin-3 in HL-60N cells expressing either a non-specific shRNA (NS-shRNA) or a kindlin-3-specific shRNA (K3-shRNA). (L & M) NETs released from HL-60N cells expressing either NS-shRNA or K3-shRNA under PMA stimulation were evaluated by Hoechst staining (L) or SYTOX green (M). (N) Production of 2-OH-E+ in HL-60N cells expressing either NS-shRNA or K3-shRNA under PMA stimulation (100 nM, 60 minutes) was quantified. Data represent means ± SD of 3 or more independent experiments; **P<0.01 (paired Student t test).

