
Figure 4.
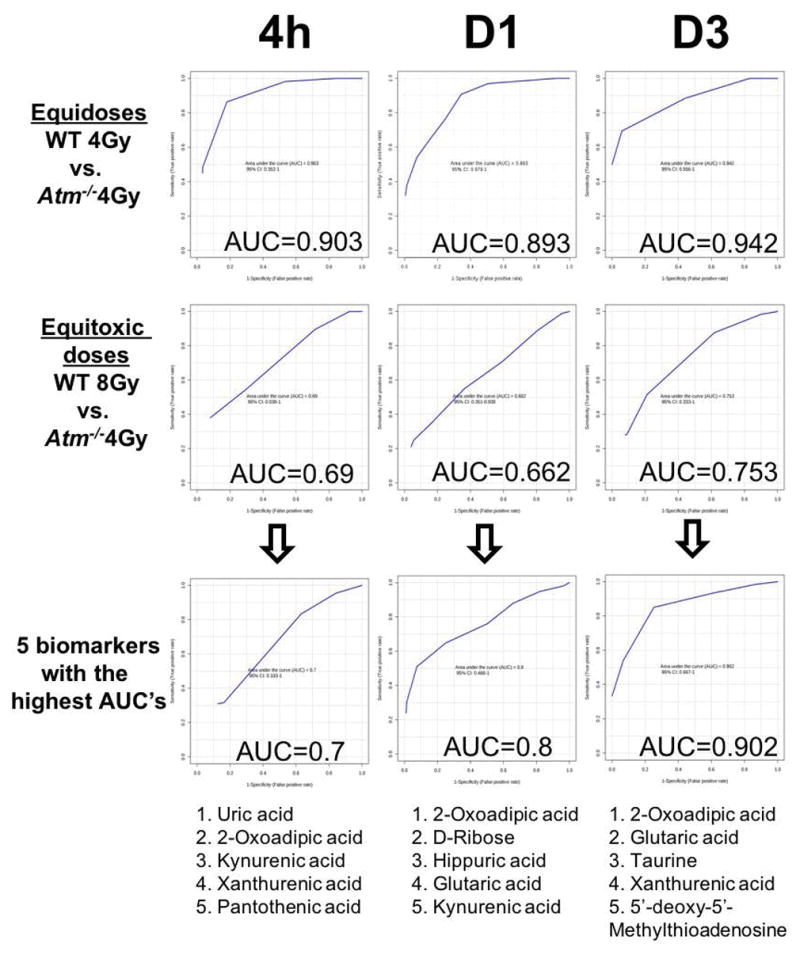
ROC curves and AUC values of equidose or equitoxic exposures with twelve identified metabolites over three time points. Equidose graphs showed a high sensitivity and specificity, while equitoxic doses showed an improvement by restricting the signature to the highest qualified metabolites (n=5).