
Figure 5: Verification of viral-mediated BDNF overexpression in mPFC.
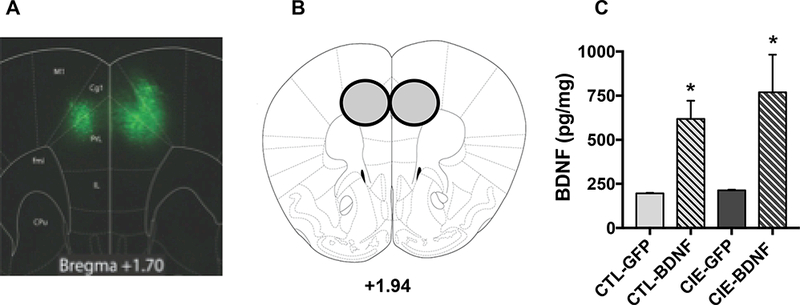
(A) Representative viral expression within the mPFC visualizing the native GFP tag. (B) Schematic of tissue punch for mPFC samples analyzed for BDNF protein levels. (C) BDNF protein content (pg/mg) in mPFC samples measured by ELISA. BDNF protein expression was significantly greater in CIE-BDNF and CTL-BDNF groups of mice compared to those infused with control virus (*, p< 0.05).