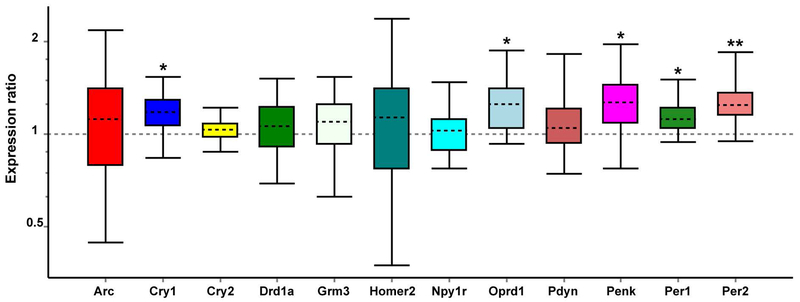
Figure 7:
Quantitative real-time PCR analysis of expression changes for addiction and reward-related genes in the female NAc. Relative expression distribution of mRNA (y-axis) represented as a ratio of Nr1d1 shRNA versus Scr-shRNA, was normalized against two reference genes, Ywhaz and β-actin, and shown by box-and-whisker plot as medians (dashed lines), interquartile range (boxes) and ranges (whiskers). Ratios over one indicate genes with higher expression in Nr1d1 shRNA than in Scr-shRNA mice. * P < 0.05, ** P < 0.01, Nr1d1 shRNA mice versus Scr-shRNA control.

