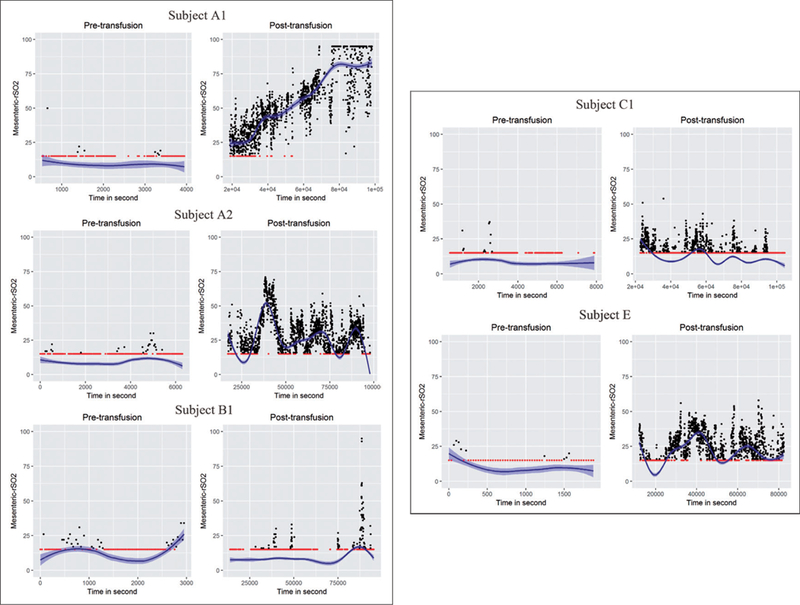
Figure 3.

Observed pre- to post-transfusion rSO2 series and the estimated underlying smooth functions for selected individual preterm infants from Emory NIRS study. The red dots are rSO2 measurements occurring at the low detection limit of 15%.

Observed pre- to post-transfusion rSO2 series and the estimated underlying smooth functions for selected individual preterm infants from Emory NIRS study. The red dots are rSO2 measurements occurring at the low detection limit of 15%.