
Figure 5.
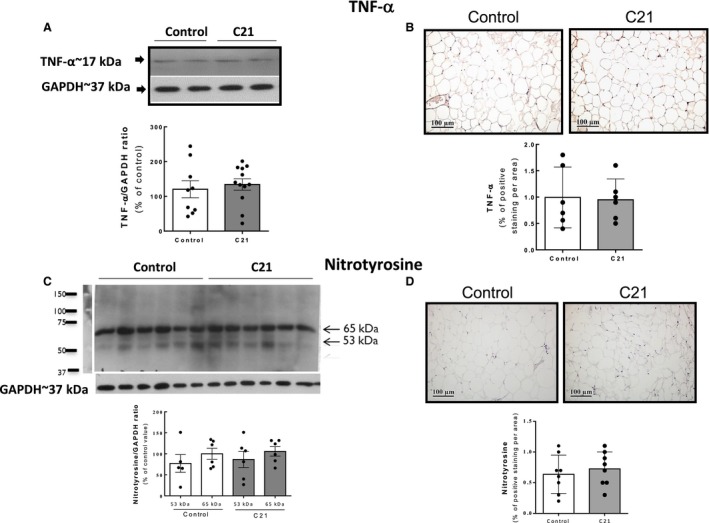
Parameters of inflammation/nitrosative stress are unaltered in adipose tissue after chronic administration of compound 21. (A) and (B) Levels of TNF‐α determined by WB and IHC. (C) and (D) levels of nitrotyrosine determined by WB and IHC. Quantification of specific bands was performed with Gel‐Pro Analyzer software. (C) For nitrotyrosine quantification, the intensity of the most predominant bands in the WB (of unknown identity), with MWs of 53 and 65 kDa, respectively, were quantified in each sample. Bar graphs are the means ± SE. (B) and (D) Positive TNF‐α and nitrotyrosine staining as detected by immunohistochemistry was quantified using Image‐Pro Plus software. Data were analyzed by unpaired two‐tailed Student's t test. C21, n = 9 per group, control, n = 12 per group for TNF‐α quantification. For nitrotyrosine quantification by Western blotting: C21, n = 6 per group; control, n = 6 per group and by immunohistochemistry: C21, n = 9 per group; control, n = 9 per group. WB, western blotting.