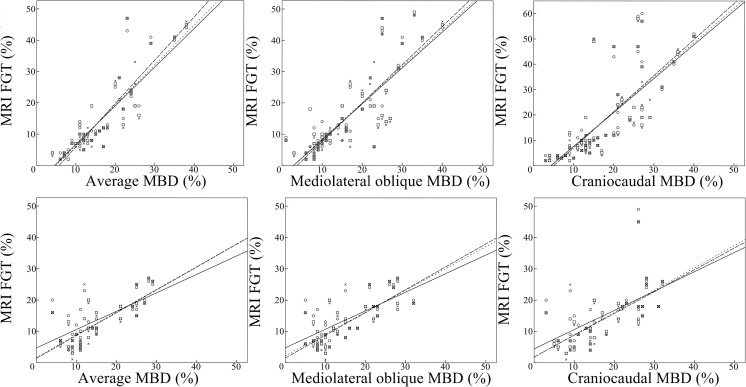
Fig. 3.
Scatterplots of FGT-%s and mammographic breast densities measured with mammography and tomosynthesis. In upper row, MRI FGT-% vs MBD from mammography. In lower row, MRI FGT-% vs MBD from tomosynthesis. Square, measurement with 4.0-mm slices; cross, measurement with 2.0-mm slices; circle, measurement with 0.7-mm slices; dotted line, regression line for 4.0-mm slices; dashed line, regression line for 2.0-mm slices; straight line, regression line for 0.7-mm slices

