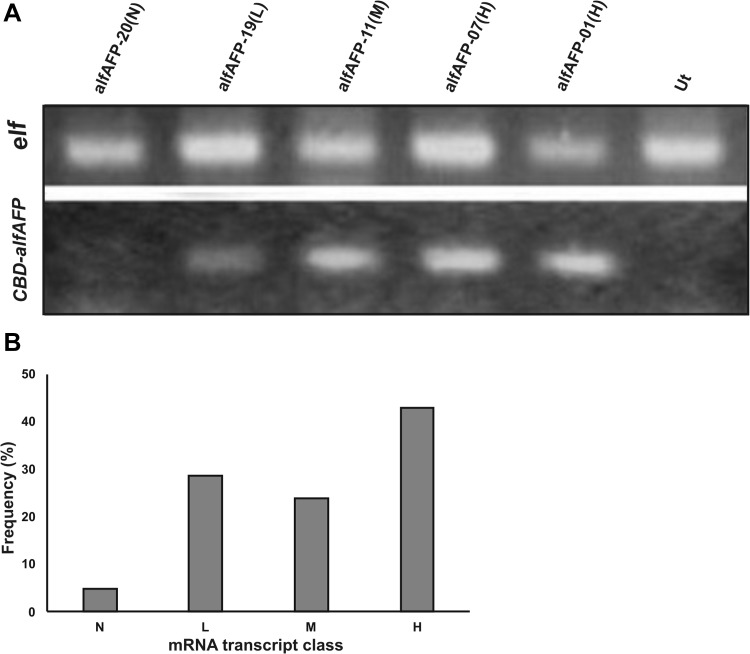
Fig. 2.
a Semi-quantitative RT-PCR analysis of the selected transformants; The upper panel shows the PCR product using the primers designed for the replication of the housekeeping gene, elf1α, served as the internal control, and the lower panel shows a 120 bp PCR product of CBD-alfAFP recombinant gene in selected transgenic plants; b distribution of individual transformants over different classes of transgenic mRNA expression; The panel defines four different mRNA expression levels in transformants: none (N), low (L), medium (M), and high (H)

