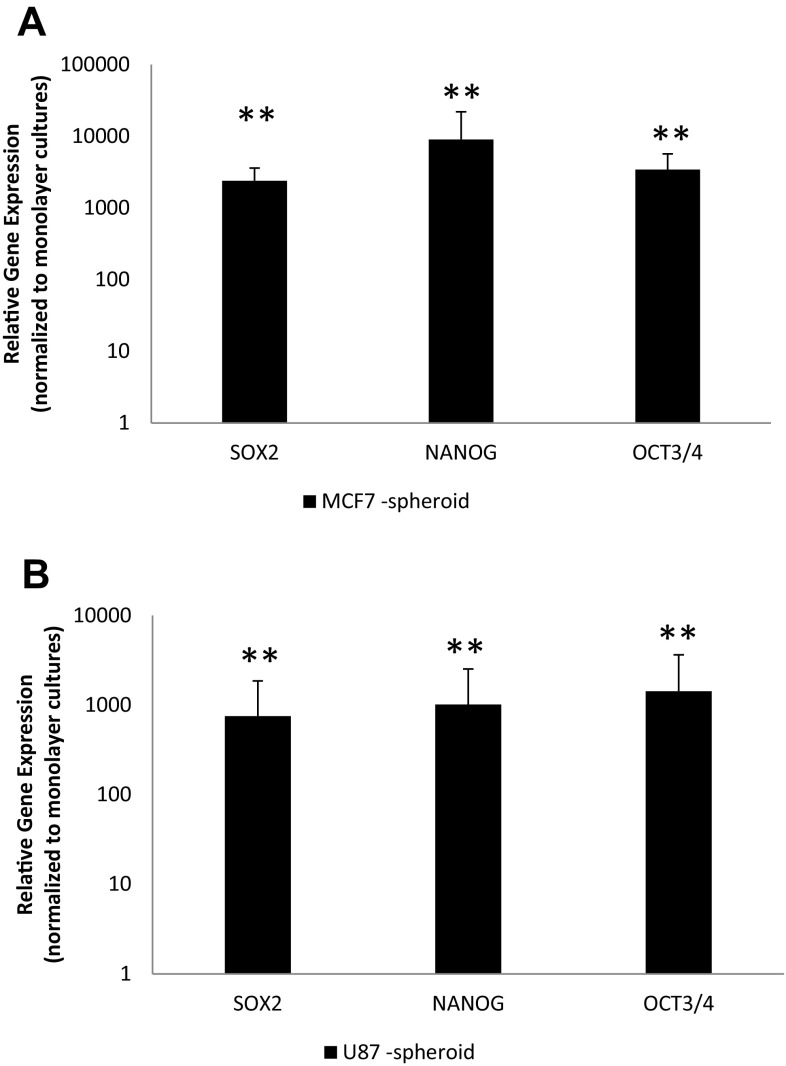
Fig. 2.
Expression of stem cell markers. MCF-7 and U87-MG cells were cultured as monolayers and spheroids. RNA was isolated and qRT-PCR was performed for SOX2, NANOG and OCT4. Relative gene expression was plotted for a MCF-7 and b U87-MG cells cultured as spheroids, normalized to monolayers. **p < 0.01 compared to naïve samples

