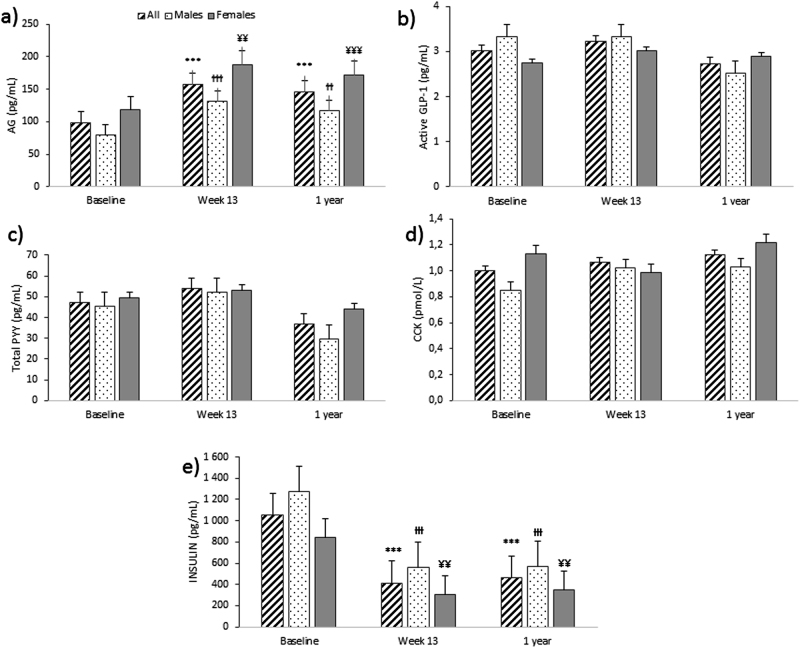
Fig. 4.
Basal plasma concentrations of appetite-related hormones: active ghrelin (AG) (a), active glukagon like peptide-1 (GLP-1) (b), total peptide YY (total PYY) (c), cholecystokinin (CCK) (d) and insulin (e), over time in all participants, males and females. Results presented as estimated marginal means ± SEM. Symbols denote significant differences from baseline in all participants: ***P < 0.001, males: ƗƗƗP < 0.001 and ƗƗP < 0.01 and females: ¥¥¥P < 0.001 and ¥¥P < 0.05

