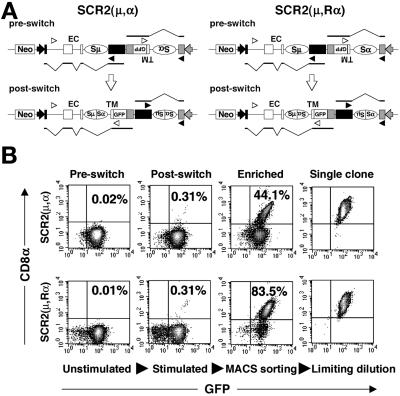
Figure 1.
Construction of inversion-type switch substrates and the detection of switch junctions. (A) Schematic diagram of inversion-type switch substrates SCR2(μ,α), in which the Sα region is the same orientation as the SRα promoter, and SCR2(μ,Rα), in which the Sα is inverted to the SRα promoter. EF-1α and SRα promoters are represented by closed and shaded arrows, respectively. Exons are shown by rectangles. EC and TM indicate two exons of the EC portion and the TM exon of the mouse CD8α gene, respectively. Two kinds of preswitch transcripts and postswitch transcripts are depicted below each substrate, and v-shaped lines indicate splicing. Arrowheads indicate primers for junction amplification. (B) Flow cytometry profiles of SCR2(μ, α)- and SCR2(μ, Rα)-transfectant clones before and after stimulation with IL-4, transforming growth factor-β, and anti-CD40 monoclonal antibody (HM40–3) mixture. The stimulated cells were enriched to select for the CD8α-GFP-positive population by magnetic cell sorting (MACS sorting). Clones of CD8α-GFP-positive cells were obtained by limiting dilution of the sorted cells.

