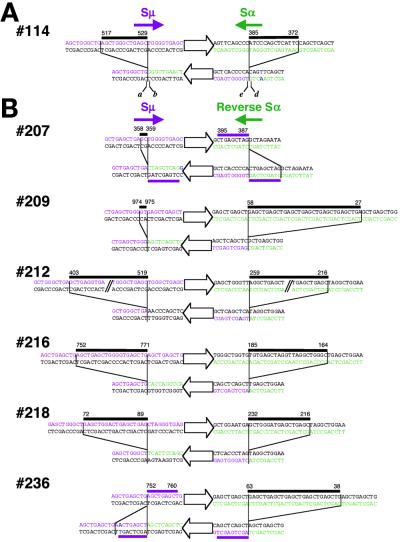
Figure 2.
Inversion-type class switching in SCR2(μ, α)- (A) and SCR2(μ, Rα)- (B) derived clones. For each clone, the upper and lower sequences represent preswitch and postswitch sequences, respectively. Open arrows in the center of each sequence indicate the orientation of a segment between the two S regions. The deletion of Sμ (magenta for nontemplate strand) and Sα (green for nontemplate strand) sequence is marked by black bars on the preswitch S regions. The duplication is marked with magenta bars on preswitch and postswitch sequences. Mutations after CSR are shown in blue letters. Magenta and green arrows indicate the orientation of transcription of Sμ and Sα, respectively. The numbers on the sequences indicate positions in S regions for the beginning and end of deletions or duplications. In A, the positions of nucleotides at Sμ and Sα side border of upstream junction are indicated by a (516 for clone no. 114, see Table 1) and b (386), respectively. Similarly, positions of the downstream junction are indicated by e (530) and d (371). The lengths of deletion in Sμ and Sα are calculated by e − a − 1 and b − d − 1, respectively.

