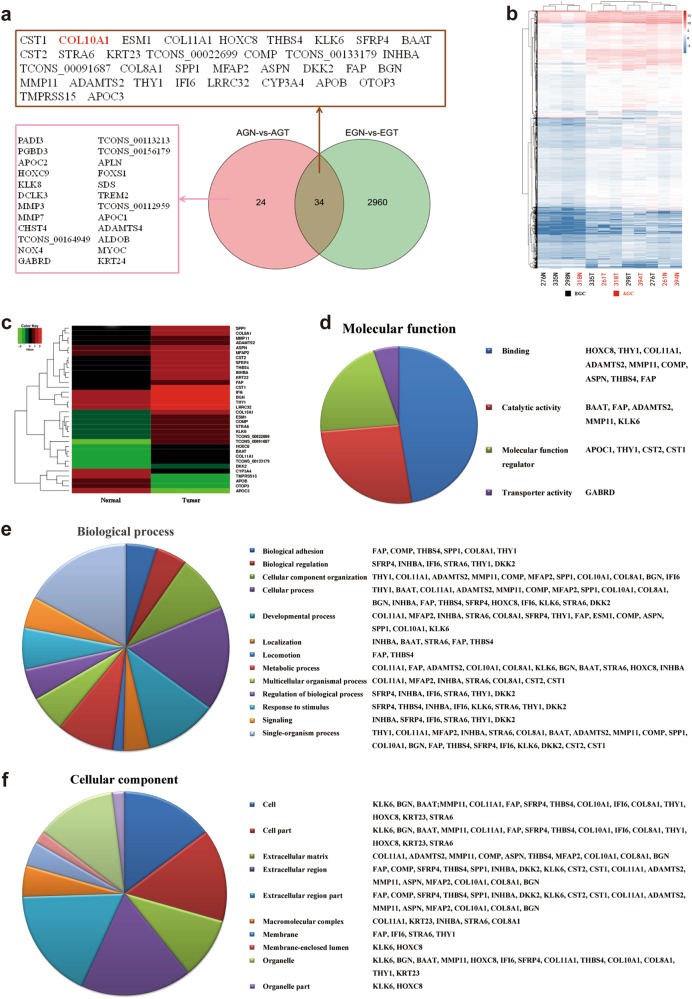
Fig. 1. The difference in identified DEGs in the tumor compared with the normal phenotype.
a Venn diagram of DEGs in different tumor stages. EGN and EGT represented Stage I normal and tumor groups, AGN and AGT represented Stage IV normal and tumor groups. b Hierarchical clustering of 12 samples using all DEGs. The number of EGC samples (black) and AGC samples (red) are indicated below heatmap. c Heat-map analysis of the 34 DEGs that were differentially expressed between the normal and tumor groups both in the EGC and AGC groups. Individual genes are arranged in rows and groups in columns. d, e, f Pie chart representation of the Gene Ontology (GO) annotations for DGEs in RNA-req and summarized according to molecular function, biological process and cellular component, among the 26 up-regulated genes both in the EGC and AGC groups, respectively

