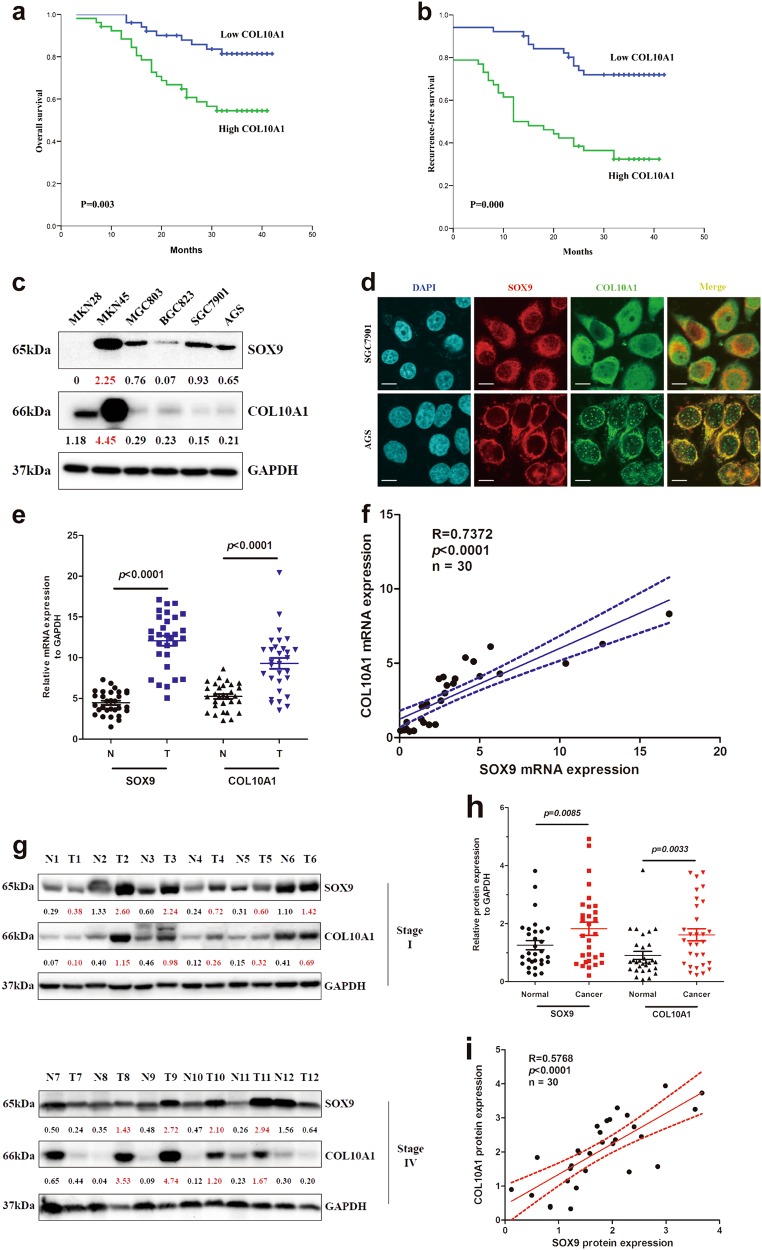
Fig. 2. The prognostic value of COL10A1 mRNA in OS and RFS, and the expression of SOX9 and COL10A1 in cell lines and GC tissues.
a, b Kaplan–Meier curves and log-rank test showing the prognostic value of COL10A1 mRNA in OS and RFS in 103 gastric cancer patients. c SOX9 and COL10A1 proteins were detected in GC cell lines by western blot analysis. d SOX9 and COL10A1 were localized by confocal immunofluorescence microscopy in the SGC7901 and AGS cell lines. e, f SOX9 and COL10A1 mRNA expression levels in normal and GC tissues. The mRNA expression levels of SOX9 and COL10A1 were semi-quantified, and the correlation between these two genes was evaluated with Spearman’s rank correlation method. g Proteins isolated from normal and GC tissues were analyzed by western blot analysis of SOX9 and COL10A1. The upper panel represents Stage I normal and tumor specimens; the lower panel represents Stage IV normal and tumor specimens. h and i SOX9 and COL10A1 protein expression levels in normal and GC tissues. The protein expression levels of SOX9 and COL10A1 were semi-quantified, and the correlations between these two genes were evaluated with Spearman’s rank correlation method. Scale bars represent 10 μm in (d)

