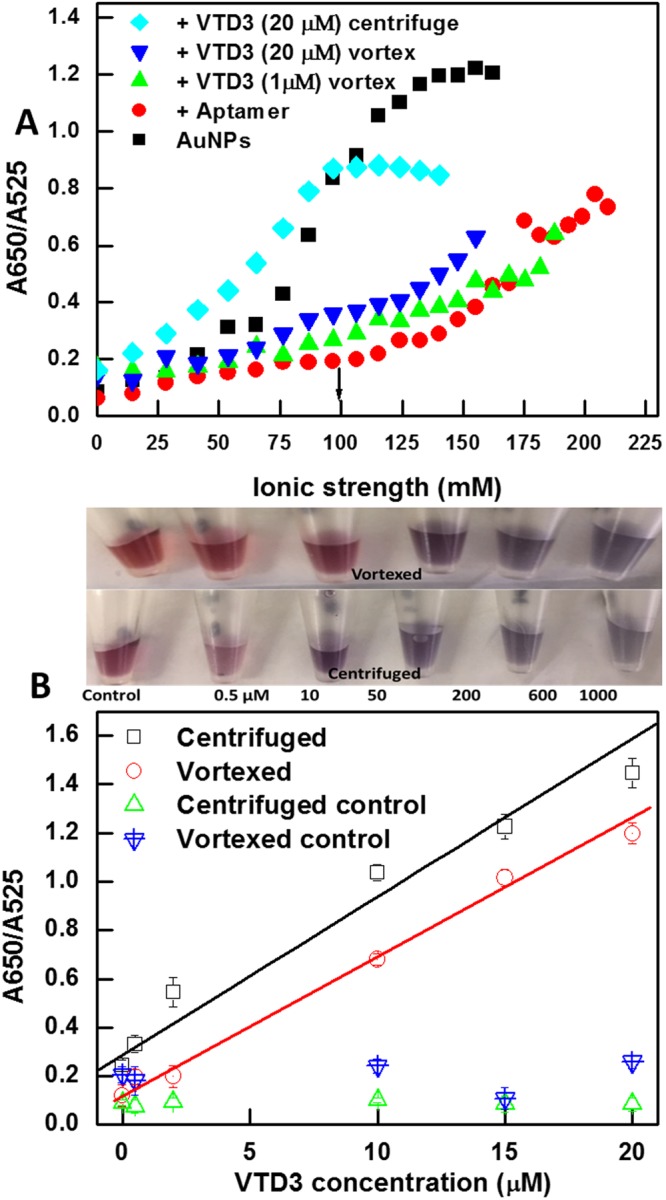
Figure 3.

(A) Salt tolerance experiments of bare AuNPs, AuNP-Bruno aptamer (100 nM), and AuNP-Bruno aptamer + VTD3 (1 µM and 20 µM, respectively) when using vortexing and centrifugation sensing methods. Optimal salt concentration is indicated by the black arrow. (B) Colorimetric aptasensor response towards a range of VTD3 concentrations (µM range) using the AuNP−Bruno aptamer (vortexed and centrifuged) compared with control experiments using AuNP-70-mer random ssDNA exposed to the same experimental steps. Top panels show photos of the sensor response in vortexed and centrifuged conditions for both cases. Raw UV-visible spectra are provided in the Supporting Information. Error bars indicate standard deviation of the mean of three independent experiments starting from particle functionalization.
