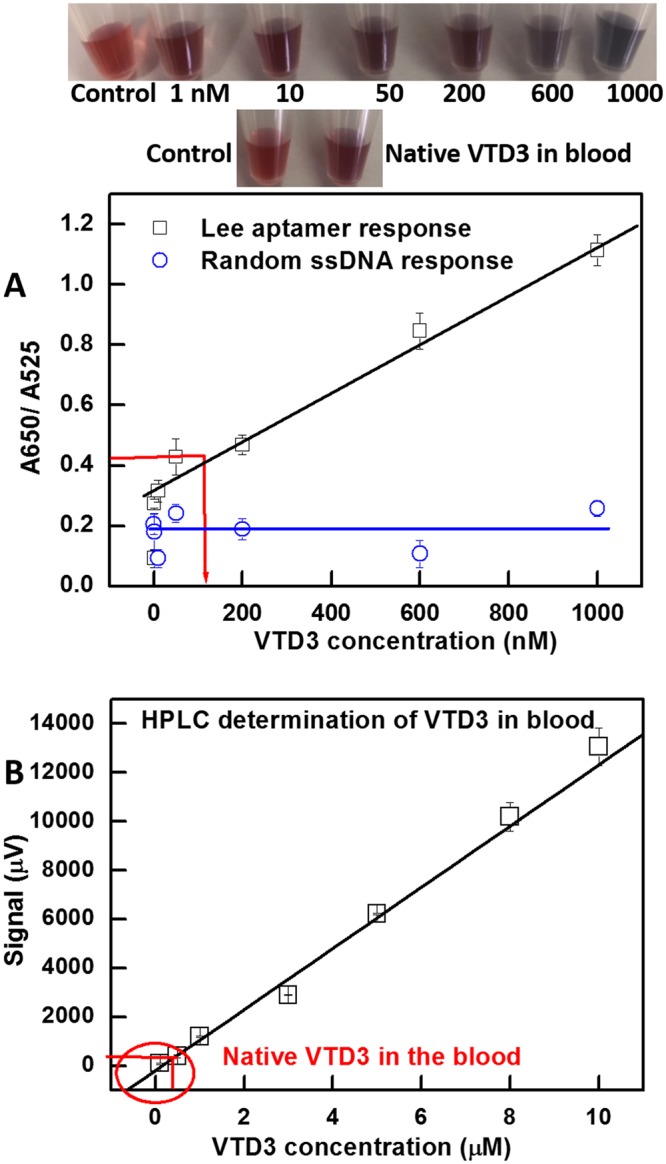
Figure 5.

(A) Colorimetric aptasensor response with Lee aptamer towards a range of VTD3 concentrations spiked into and extracted from human blood using n-hexane, with redissolution in detection buffer under the centrifugation condition compared with control experiments using AuNP-70-mer random ssDNA exposed to the same experimental steps. Top panels show photos of the sensor response towards spiked VTD3 concentrations and its response to the native VTD3 concentration in the blood. Error bars indicate the standard deviation of the mean of three independent experiments starting from particle functionalization. (B) HPLC analysis of spiked VTD3 concentration in blood samples. Red arrows indicate the signal response for native VTD3 concentration extracted from blood. Raw UV-visible spectra and HPLC chromatograms are provided in the Supporting Information.
