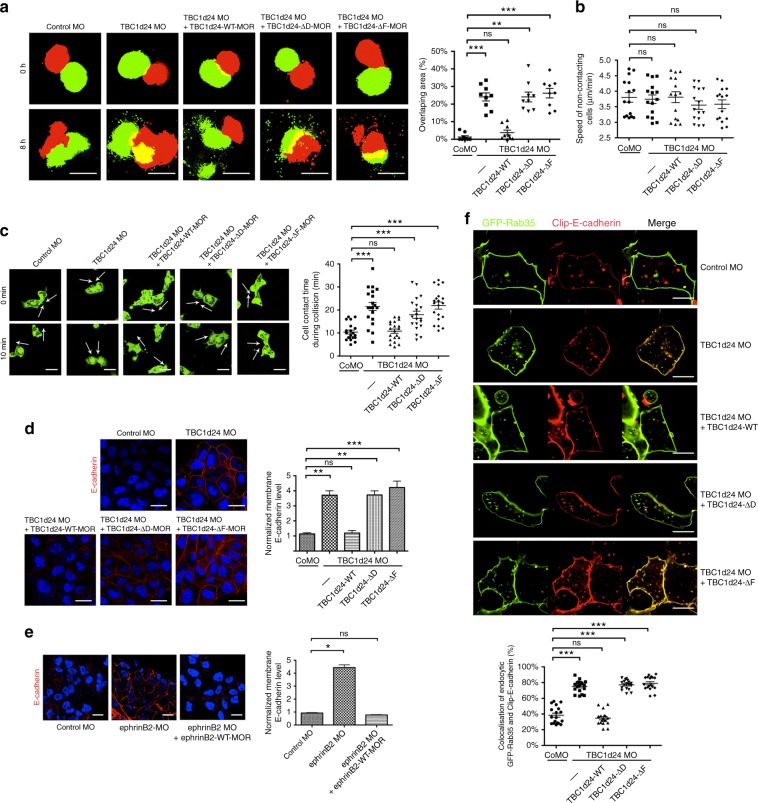
Fig. 5.
TBC1d24 modulates CIL via regulating E-cadherin. a Homotypic invasion assay. CNC explants injected with control MO or TBC1d24 MO alone or with the indicated TBC1d24 MO-resistant WT or mutant RNA and juxtaposed with RFD-injected CNC explants. Invasion is determined by the amount of explant overlap (yellow). Quantification with non-parametric ANOVA (Kruskal–Wallis test), P < 0.0001; Bar, 200 μm. b Histogram depicts ex vivo analysis of the speed of non-contacting CNC cells (μm/min) injected with the indicated MOs and RNAs. Quantification with one-way ANOVA, P = 0.8846. c Ex vivo migrating neural crest cell contact assay. The white arrows in the IF still images (from Supplementary Movie 1) of cells from CNC explants injected with the specified MOs and RNAs indicate the direction of migration at the indicated time of collision. The histogram indicates contact time during collisions of cells injected with control or TBC1d24 MOs alone or with the indicated TBC1d24 RNAs. Data represents means ± s.e.m from four biological repeats. Quantification with one-way ANOVA, P < 0.0001; Bar, 20 μm. d IF of CNC tissue using anti-E-cadherin Ab (red) from the embryos injected with control or TBC1d24 MOs alone or with the indicated TBC1d24 RNAs. Histogram represents relative E-cadherin levels. Quantification with non-parametric ANOVA (Kruskal–Wallis test), P < 0.0001; Bar, 20 μm. e IF of CNC tissue with an E-cadherin Ab (red) from the embryos injected with control or ephrinB2 MOs alone or with MO-resistant ephrinB2 RNA. Histogram represents relative E-cadherin levels. Quantification with non-parametric ANOVA (Kruskal–Wallis test), P < 0.0001; Bar, 20 μm. f IF of CNC explants expressing GFP-Rab35 (green) and Clip-tagged E-cadherin (red) also injected with control or TBC1d24 MOs alone or with the indicated TBC1d24 RNAs. Co-localisation displayed as yellow area. Histogram represents the percentage of overlapping signal in endocytic vesicles. Quantification with one-way ANOVA, P < 0.0001. Bar, 10 μm. All histograms and scatterplots represent mean ± s.e.m from three biological repeats unless otherwise indicated; Dunn’s multiple Comparison, *P < 0.05, **P < 0.01 and ***P < 0.001, ns: no statistical differences between the groups

