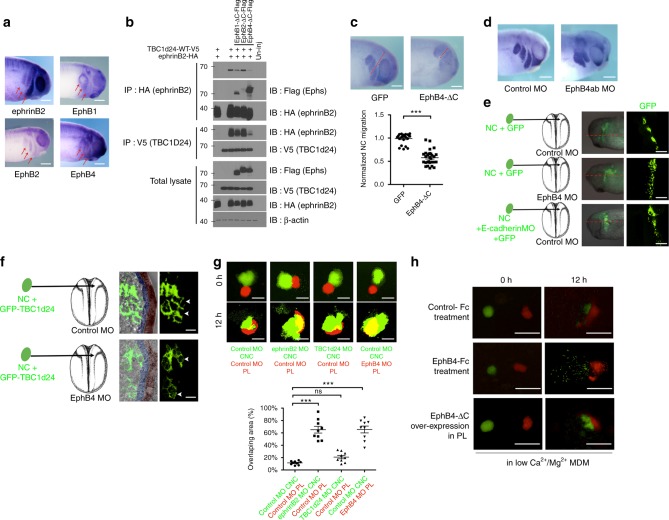
Fig. 6.
EphrinB2 and its cognate Eph receptor, EphB4, regulate appropriate CNC cell migration. a WISH shows ephrinB2 and EphB2 expression in neural crest cells and EphB1 and EphB4 in boundary of CNC streams (red arrows). Bar, 200 μm. b Co-IP and western blot using gastrula embryos injected with TBC1d24 RNA and ephrinB2 wild-type RNA along with truncated receptor EphB1-ΔC, EphB2-ΔC or EphB4-ΔC RNAs (1 ng each). c, d WISH using Twist antisense probe in the embryos injected into the D.1.2 blastomere with the indicated MOs or RNAs (red dotted lines indicate extent of CNC migration). Histogram depicts relative CNC migration (quantification with Mann–Whitney test: ***P = 0.0004, two-tailed). Bar, 200 μm. e Neural crest tissues injected with GFP RNA alone or along with E-cadherin MO were dissected and transferred into EphB4 MO or control MO-injected embryos as indicated. Confocal microscopic images of embryos sectioned along the red lines and the neural crest streams displayed. Bar, 200 μm. f GFP-TBC1d24 expressing neural crest tissues were dissected and transferred into EphB4 MO- or control MO-injected embryos. Embryos were sectioned and a magnified image shows that membrane localisation of GFP-TBC1d24 at the NC (neural crest)–PL (placode) contact site (the white arrow heads). Blue, placodes; brown, superficial ectoderm. Bar, 20 μm. g Heterotypic NC-PL invasion assay. Embryos were injected with the indicated MOs, and explants excised and placed juxtaposed. IF of GFD-labelled neural crest explants injected with the indicated MO (in green) juxtaposed to RFD-labelled placode explants injected with the indicated MO (red). Invasion of CNC into placode denoted by yellow area in image and depicted in histogram. Quantification with one-way ANOVA, P < 0.0001; bar, 400 μm. h CNC chemoattraction assay. CNC (injected with GFD—green) or placode [(PL) injected with RFD—red] tissues were dissected at stage 20, placed 400 μm apart and incubated in low Ca2+/Mg2+ medium for 12 h and treated with the indicated clustered Fc or injected with EphB4-ΔC RNA and imaged. Bar, 400 μm. All histograms and scatterplots represent mean ± s.e.m from three biological repeats; Dunn’s multiple Comparison, ***P < 0.001, ns: no statistical differences between the groups

