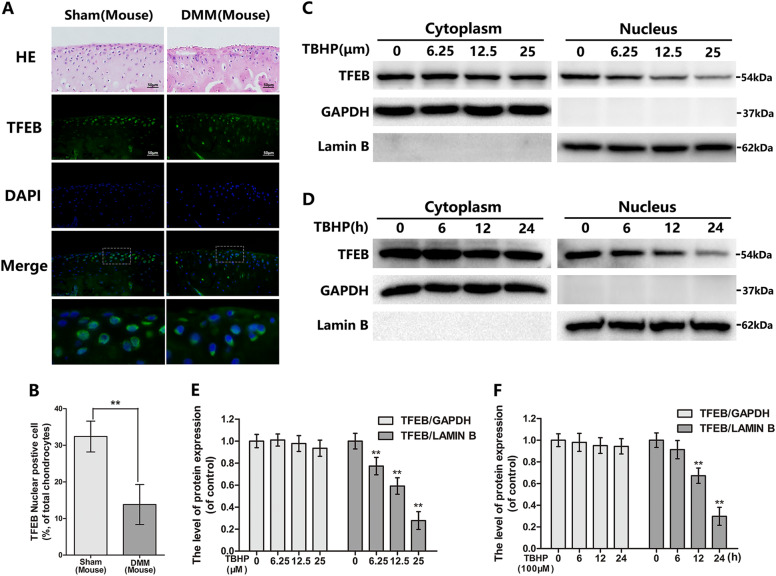
Fig. 2. The nuclear expression of TFEB in mouse chondrocytes is decreased in OA model in vivo and in vitro.
a Representative H&E staining and immunofluorescence staining of TFEB in mouse knee articular cartilage from sham and DMM model. (bar: 50 μm) b Quantitation of immunofluorescence staining of TFEB. c–f The protein expression of TFEB in cytoplasm and nuclear in mouse chondrocytes treated as above. All data represent mean ± S.D. (n = 5). **P < 0.01

