Figure 4.
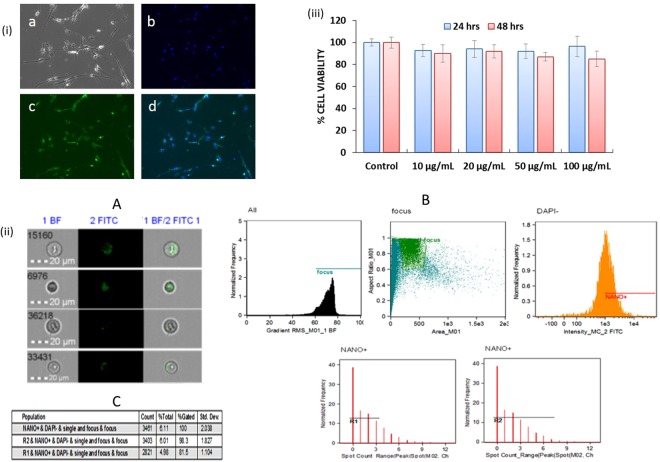
(i) Qualitative analysis of cellular uptake of FITC-tagged NF in HA by fluorescence microscopy: FITC-tagged NF (concentration- 100 μg/mL) in HA after 3 hours of treatment. (a) Control cell bright field image; (b) Cell nuclei stained with DAPI (blue); (c) FITC tagged drug loaded NF (green); (d) Composite image show green and blue fluorescence inside the cells, confirm the cellular uptake of the NF. Images taken at 10X magnification using Fluorescence microscopy (Zeiss, Wetzlar, Germany); (ii) Quantitative analysis of FITC-tagged NF in HA by flow cytometry: (A) Cell images of internalized and surface-bound NF in HA: Representative images from the Amnis ImageStreamX; (B) Schematic of the gating strategy utilized to determine internalized versus surface bound nanoparticles: To gate on cells in-focus, the IDEAS feature Gradient RMS of the bright field image is plotted in a histogram, further Green fluorescence FITC positive cells were selected by gating on the cells with high Max Pixel values and Intensity in the green fluorescence channel and DAPI negatives. Also, cells with internalized NF were selected by choosing the cell population with an internalization score equal to or greater than 0.3. Representative images are presented for each gate shown; (C) Spot analysis statistics: Cells in the “internalized” gate were further characterized based on the number of spots because there were some cells with background staining that were counted as internalized but had a spot value of zero as shown in table for different region R1 (0–3 counts) and R2 (0–8 counts); (iii) In-vitro cytotoxicity of NF: Results show the percentage of cells viability after treatment with different NF concentrations (10, 20, 50 and 100 µg/mL). HA (1 × 10⁵ cells) were grown in 6 well culture plates and cells were infected with 20 ng of HIV-1 for overnight. The uninfected virus was washed and cells were infected for a total of 14 days. On 15 day of infection, NF was added at different concentrations to the respective wells and incubated for 24 and 48 h respectively. After total 16th and 17th day of post-infection (dpi), cell viability was measured by using the MTT assay (*p ≤ 0.05; NS-Not Significant).

