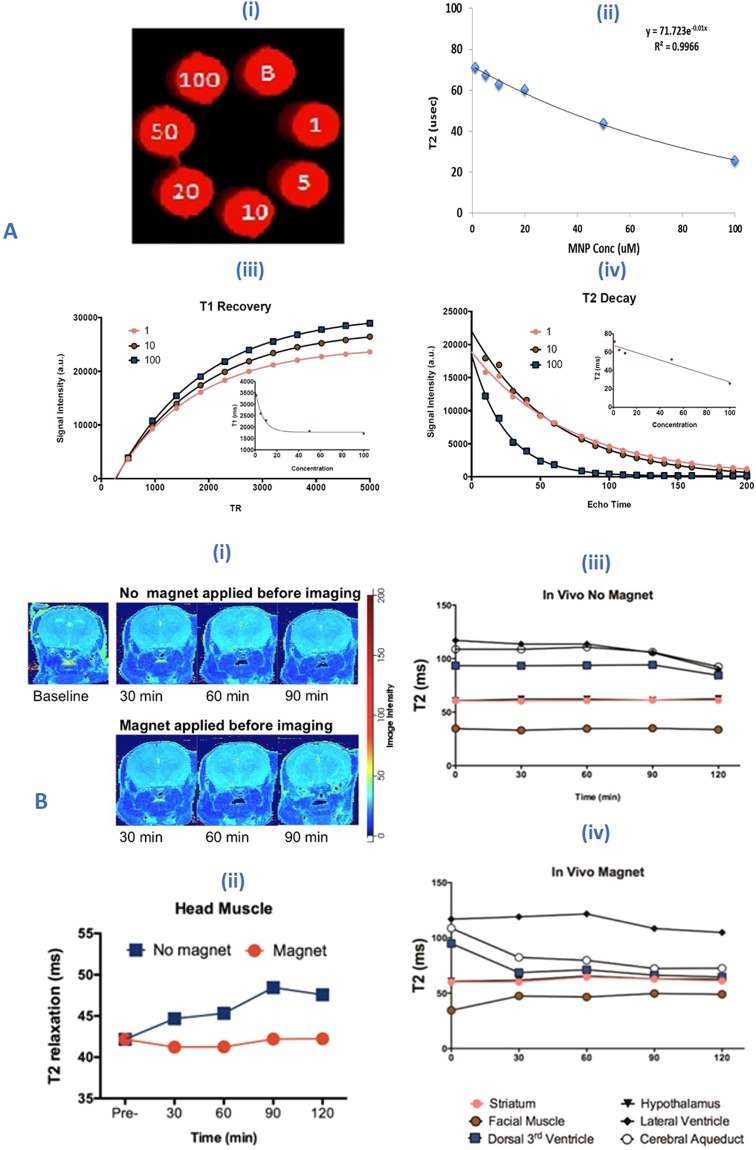
Figure 5.
(A) In-vitro Phantom studies: (i-ii) MRI images of phantoms of MNPs and concentration (0–100 µM) dependent T2 decrease in contrast; iii-iv) T2-decay and T1 recovery images at various concentrations of the MNP suspended in 1% agar solution in different condition i.e. 1, 5, 10, 20 and 100 uM; (B) In-vivo MRI studies: Data represented NF treated (20 mg/Kg) mice brain after 3 hrs of injection. Changes in T2 relaxation before and after intravenous administration of magneto-liposome NF: (i) T2 relaxation map at baseline, 30–90 minutes post administration; (ii) Average T2 signal intensity from muscle surrounding brain in the head (Magnet condition (0.8 T) received head magnet placement prior to imaging for 3 hours; no magnet condition were without magnet treatment); (iii-iv) T2 signal intensity from different region of brain (different color bullet represents the different location of brain as given below the image).

