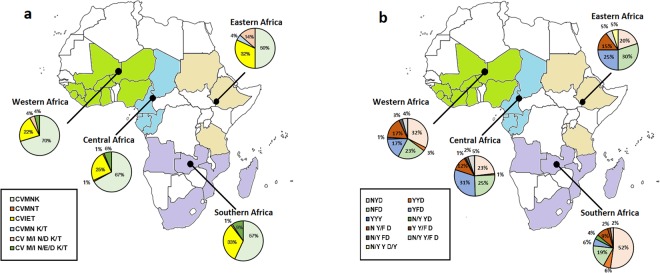
Figure 1.
Geographical distribution of Pfcrt (Panel a) haplotypes and Pfmdr1 (Panel b) haplotypes in imported P. falciparum isolates from Africa. Color difference in the map represents the parasites distribution in Africa. No isolate involved in the study are shown in white. The isolates returned from Eastern Africa, Western Africa, Central Africa and Southern Africa are shown in primrose yellow, green, light blue and purple, respectively. Pie charts presenting the frequencies of different haplotypes.

