Figure 9.

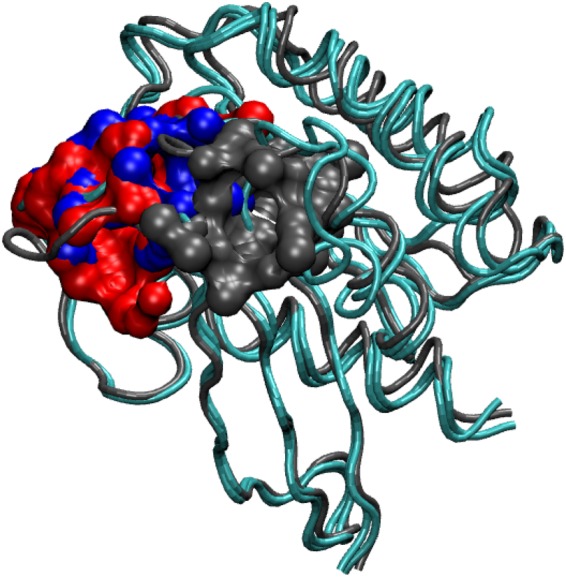
Largest cavity location of Rap domain in original crystal structure and last 5 ns averaged structures of GTP (red; volume: 605.96 Å3), Crystal structure(blue; volume: 521.01 Å3) and GTP-PSER11(black; 278.01 Å3) cases.

Largest cavity location of Rap domain in original crystal structure and last 5 ns averaged structures of GTP (red; volume: 605.96 Å3), Crystal structure(blue; volume: 521.01 Å3) and GTP-PSER11(black; 278.01 Å3) cases.