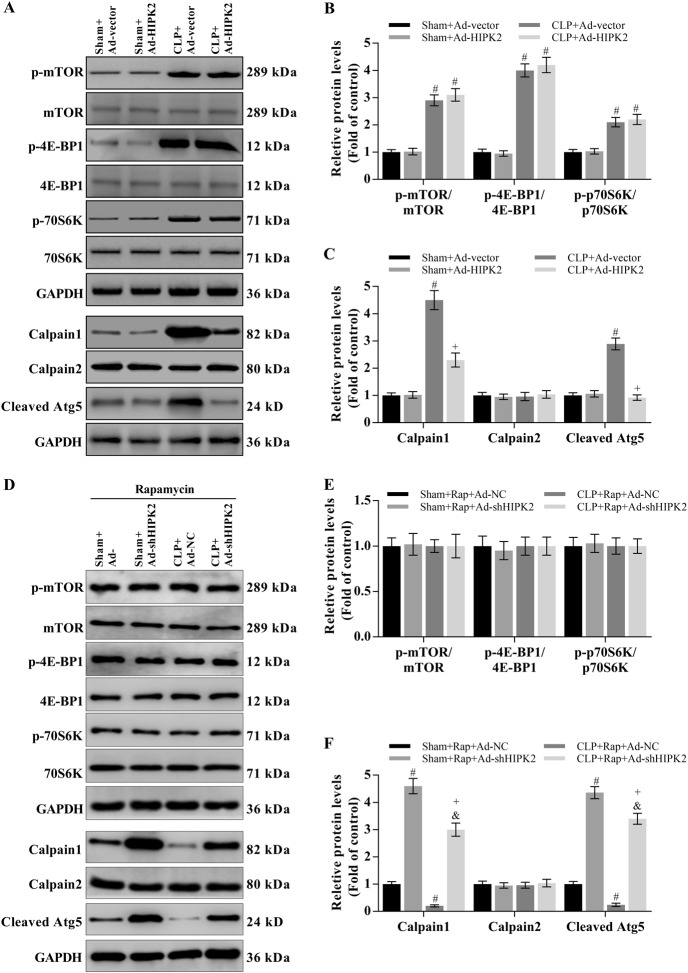
Fig. 7. Effect of HIPK2 on CLP-induced mTOR and calpain activation in the mouse liver.
a, b, c Effect of Ad-HIPK2 on p-mTOR, p-4E-BP1, and p-p70S6K levels, as determined by western blotting (a, b) and effect of Ad-HIPK2 on the activation of the calpain system, as analysed by western blotting (a, c). The results of the corresponding semi-quantitative analysis of protein levels was based on the optical density measured using ImageJ software. Data are presented as means ± SEM and are representative of three separate experiments, #p < 0.05 compared with the sham plus Ad-vector group (control), + p < 0.05 compared with the CLP plus Ad-vector group. d, e, f Effect of Ad-shHIPK2 on p-mTOR, p-4E-BP1 and p-p70S6K levels after the administration of rapamycin (1 mg/kg per day) for 24 h, as determined by western blotting (d, e) and effect of Ad-shHIPK2 on the activation of the calpain system in the presence of rapamycin, as analysed by western blotting (d, f). Results of the corresponding semi-quantitative analysis of protein levels based on the optical density measured using ImageJ software. Data are presented as means ± SEM and are representative of three separate experiments, #p < 0.05 compared with the sham plus Ad-NC group, + p < 0.05 compared with the CLP plus Ad-NC group, &p < 0.05 compared with the sham plus Ad-shHIPK2 group

