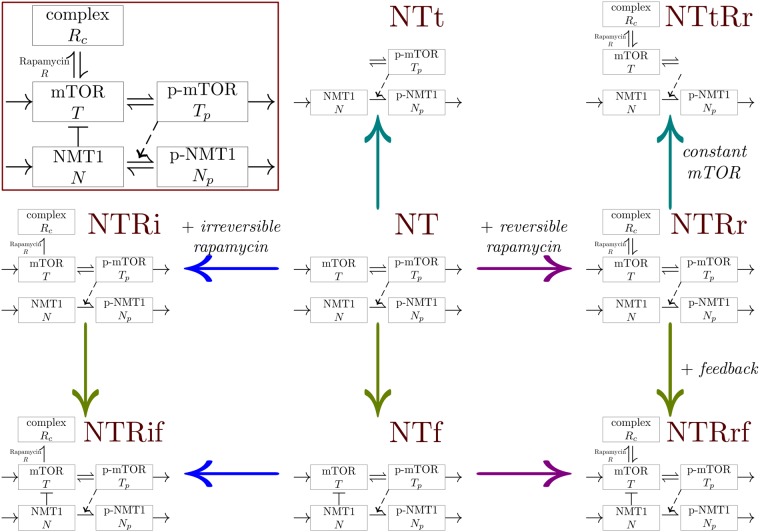
Figure 3.
Derivation of the models studied, starting from model NT and applying multiple assumptions (constant total mTOR, feedback regulation of mTOR by NMT1 and rapamycin binding); corresponding graphs of interactions are in the background. For models with constant total mTOR, only the dynamics of T and Rc are considered with rapamycin, thus Tp = Tt − T − Rc while without rapamycin only Tp is explicitly described then T = Tt − Tp. One may note that there is no model with constant total mTOR and irreversible rapamycin binding or feedback, to ensure biologically realistic dynamics. (Inset) Schematic relations between the model variables, corresponding to System (1). The dashed arrow indicates that p-mTOR is activating the phosphorylation of NMT1. The bar-headed line represents an inhibition and the arrows indicate a transfer or an activation.

