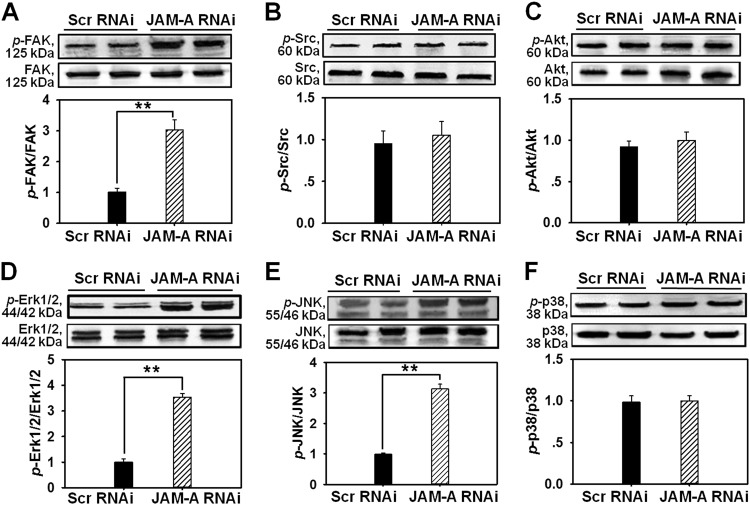
Fig. 3. Changes on the protein levels of selected signaling molecules after JAM-A silencing in primary keratinocytes.
Western blot analysis compared the expression of the total FAK (a), Src (b), Akt (c), Erk1/2 (d), JNK (e), p38 (f), and their corresponding phosphorylated forms in keratinocytes before and after JAM-A knockdown. Densitometric analysis on the levels of phosphorylated proteins were normalized against the corresponding total protein levels, which was then designated as 1. Bars are the means ± SD, n = 4. **P < 0.01

