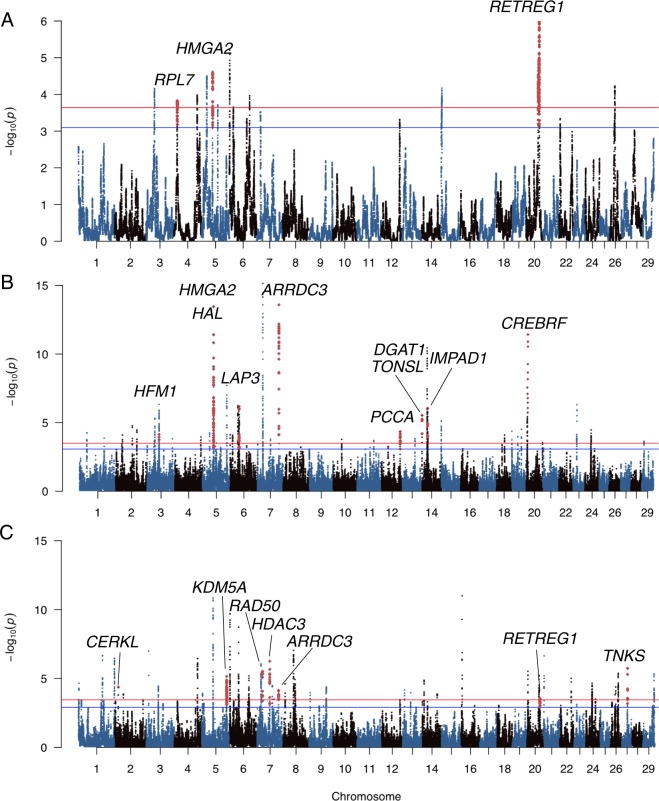
Figure 2.
Manhattan plots for putative signatures of selection analysis in cattle breeds of Asian origin with names of candidate genes discussed in the text. (A) hapFLK results for the combined set of five breeds (Yakut, Buryat, Kalmyk, Hanwoo, and Japanese Black), (B) DCMS results for the Buryat cattle, (C) DCMS results for Yakut cattle. Blue line indicates q-value = 0.1 and the red line q-value = 0.05. Colored peak regions highlight positions of the genes indicated on the plots.

