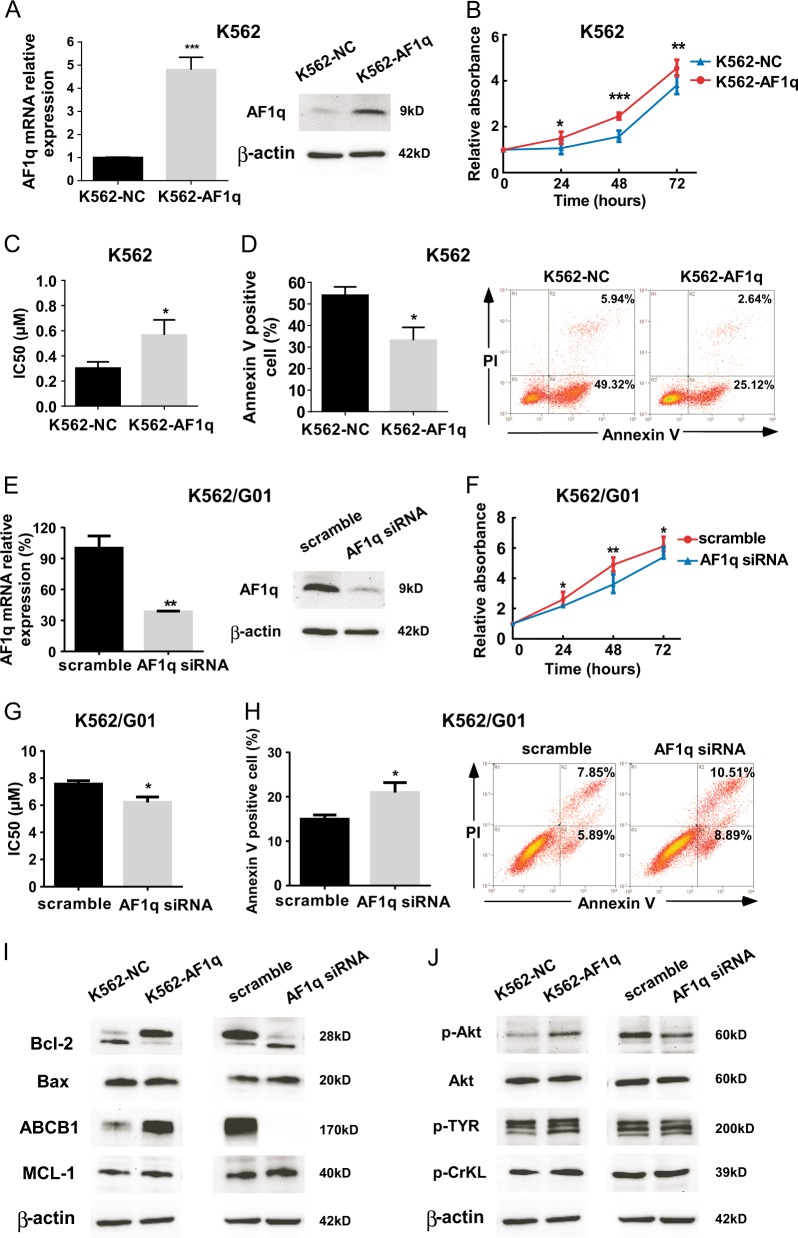
Fig. 3. AF1q overexpression promoted cell survival in the IM-sensitive CML cell line K562 and AF1q inhibition impaired cell survival in the IM-resistant CML cell line K562/G01.
a K562 cells were infected with lentiviruses harboring AF1q (K562-AF1q) or negative control (K562-NC) and AF1q expression was determined by qRT-PCR and western blot. AF1q levels were normalized to the expression of β-actin. b Proliferation of K562-AF1q and K562-NC cells were assessed by CCK-8 assays, and proliferation rates at 24, 48, and 72 h were calculated compared to the absorbance at 0 h. c IC50 values of K562-AF1q and K562-NC cells were calculated according to the cell growth inhibition after 48 h treatment with serial dilutions of IM (0, 0.1, 0.2, 0.4, 0.6, 0.8 μM). d K562-AF1q and K562-NC cells were treated with IM (0.4 μM, 48 h), and the percentage of apoptotic cells was measured by Annexin V and PI staining using flow cytometry. Representative dot plots and graphs are shown. e K562/G01 cells were transduced with AF1q siRNA or scrambled control sequences and AF1q expression was determined by qRT-PCR and western blot. AF1q levels were normalized to β-actin. f Proliferation of K562/G01 cells transduced with AF1q siRNA or scrambled control was assessed by CCK-8 assays, and proliferation rates at 24, 48, and 72 h were calculated compared to the absorbance at 0 h. g IC50 values for K562/G01 cells transduced with AF1q siRNA or scrambled control were calculated according to the cell growth inhibition after 48 h treatment with serial dilutions of IM (0, 2.5, 5.0, 7.5, 10.0, 12.5 μM). h K562/G01 cells transduced with AF1q siRNA or scrambled control were cultured with IM (5 μM, 48 h) and apoptosis was measured by flow cytometry with dual staining of Annexin V and PI. Representative dot plots and graphs are shown. Mean ± SEM. Student t test. i Expression of several proteins related to apoptosis and drug resistance were measured by western blot. j Activity of the PI3K/AKT pathway and phosphorylation levels of p-TYR and p-CrKL were was measured by western blot. *P < 0.05, **P < 0.01, ***P < 0.001

