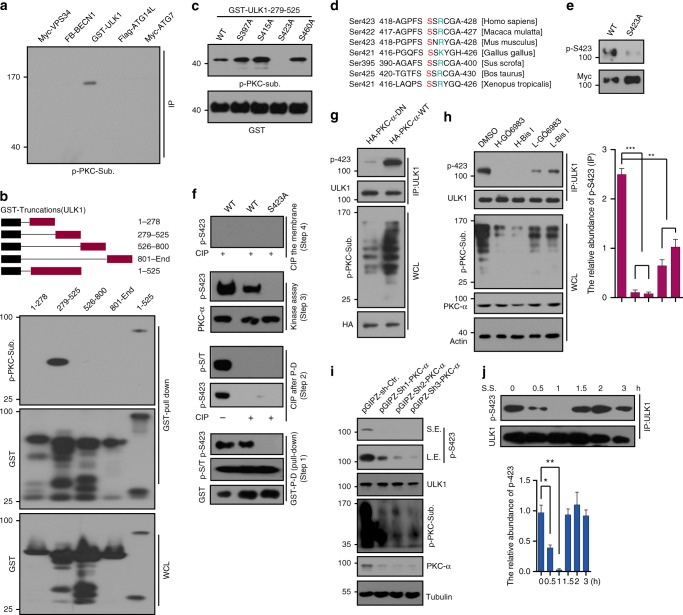
Fig. 1.
S423 of ULK1 is the phosphorylation site by PKCα. a Phosphorylation of autophagy-related proteins was detected using p-PKC-Substrate antibody. The expression of these proteins is shown in Supplementary Figure 1a. b GST-ULK1 truncations were transfected and the cell lysates were pulled down for WB analysis with p-PKC-substrate antibody. The phosphorylation site is between 279–525AA. c Mapping phosphorylation site of ULK1 by in vitro kinase assay. S423 is the phosphorylation site. d Evolutionary conservation of the ULK1 Ser423. e We generated a p-S423 antibody by ABclonal Technology, and verified the p-S423 antibody by WB. f Phosphorylation site was confirmed by in vitro kinase assay with full-length ULK1. The indicated GST-ULK1s were transfected into HEK293T cells, followed by GST pull down (Step1), Dephosphorylation of the indicated beads by CIP (Step2), PKCα kinase assay (Step3), and CIP treated the whole PVDF membrane to confirm the phosphorylation (Step4). g The phosphorylation of endogenous ULK1 was detected by p-S423 antibody after HEK293T cells were transfected with PKCα WT or DN (dominant negative). h p-ULK1 S423 was analyzed by WB after U87 cells were treated with PKC inhibitors GÖ6983 or Bis I for 0.5 h. p-PKC-substrate antibody was used to determine the efficiency of drugs. Actin, ULK1, and PKCα were used as loading controls. The relative abundance of p-S423 was quantified and shown in the right panel. i U87 cells were infected with lentivirus of non-targeting or shPKCαs for 48 h. The lysates were analyzed with p-S423 antibody by WB. Quantification of p-S423. The efficiencies of shPKCαs were analyzed by PKCα antibody. Actin was used as loading controls. j p-S423 was determined during serum starvation by WB. p-S423 was consistent with PKCα activity. p-S423 was quantified and is shown in the bottom panel. Statistical significance was measured via unpaired and two-tailed Student’s t-tests and is presented as follows: *p < 0.05, **p < 0.01, and ***p < 0.001. All error bars indicate SEM. Bars are mean ± SEM of triplicate samples. S.S.: serum starvation, WCL: whole-cell lysate, S.E.: short exposure, L.E.: long exposure

