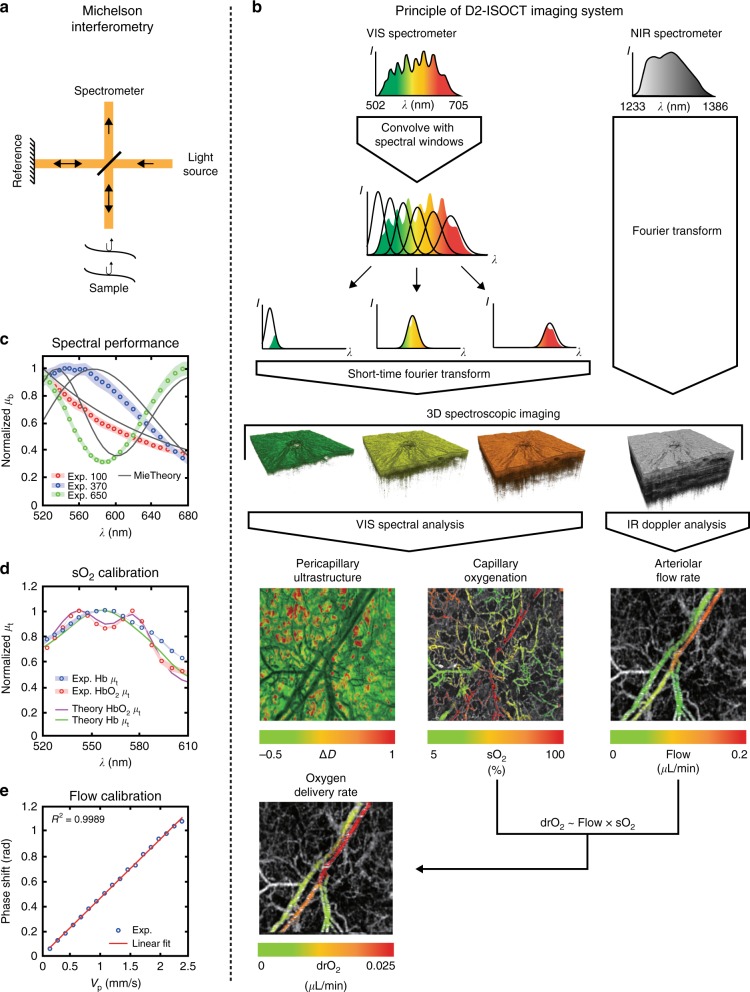
Fig. 1. D2-ISOCT imaging system.
a Michelson interferometry allows depth-resolved sample information to be obtained. b Principle behind the D2-ISOCT imaging system showing the flow from spectrometer data to the functional en face projections (field of view: 1.77 × 1.77 mm). c The backscattering spectra of beads measured with D2-ISOCT and their corresponding theoretical values from Mie theory. The bead sizes are 650, 370, and 100 nm with coefficient of variations (CV) of 3%, 3%, and 15%, respectively. d The sO2 calibration curves: the attenuation coefficients of oxygenated and deoxygenated blood measured by D2-ISOCT and calculated by Mie theory. e The flow speed calibration curve: the relationship between known flow speeds from a syringe pump in a microtube and phase shifts measured with D2-ISOCT

