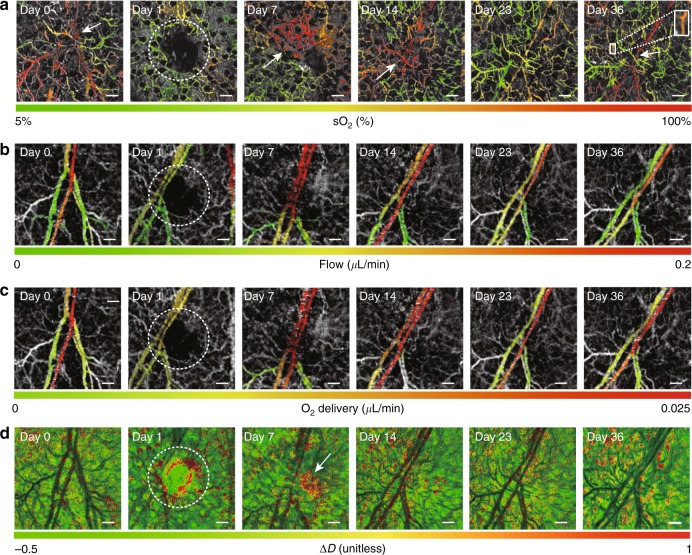
Fig. 3. Microvascular sO2, blood flow rates, drO2, and tissue ultrastructural properties of a SKH1-Elite hairless albino mouse ear during wound healing on day 0 (no wound/control), day 1 (wound made), day 7, day 14, day 23, and day 36 post biopsy punch.
a En face projections of sO2 microvasculature during wound healing. The white arrows in day 0 and day 36 indicate the bifurcations of a pair of blood vessels. The white arrows on day 7 and day 14 indicate significantly increasing sO2 in the wounded area. The white box on day 36 crops a capillary segment for which sO2 was calculated. b En face projections of blood flow rates during wound healing. c En face projections of drO2 during wound healing. d En face projections of ΔD during wound healing. The white arrow on day 7 indicates an increase in ΔD. The white dashed circles indicate the regions around the wound in a–d. Scale bars: 200 μm

