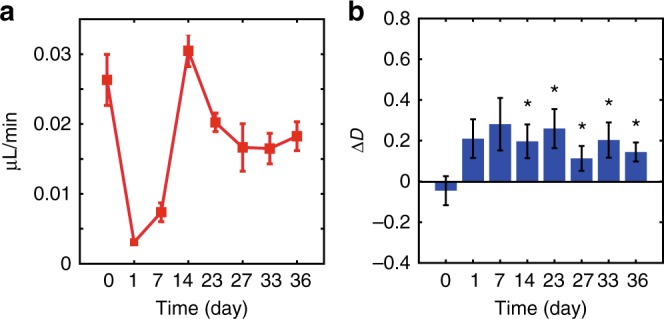
Fig. 4. Changes in ΔD and mrO2 during wound healing.

a The mrO2 calculated from the drO2 difference of the arteriole and venule of a SKH1-Elite hairless albino mouse ear during wound healing on day 0 (no wound/control), day 1 (wound made), day 7, day 14, day 23, day 26, day 33, and day 36 post biopsy punch. b A comparison of ΔD calculated from the dermal skin of a wound during the healing process. The histograms show the results averaged over five or six independent wounds. All statistical values are compared with the values of day 0. For day 0, day 7, and day 27, n = 5; for day 1, day 14, day 23, day 33, and day 36, n = 6.The depth range to calculate ΔD was 90–200 µm from the skin surface. Error bar = SEM. *p < 0.05 (the p values of day 7–day 36 are 0.055, 0.038, 0.023, 0.040, 0.038, and 0.037, in order)
