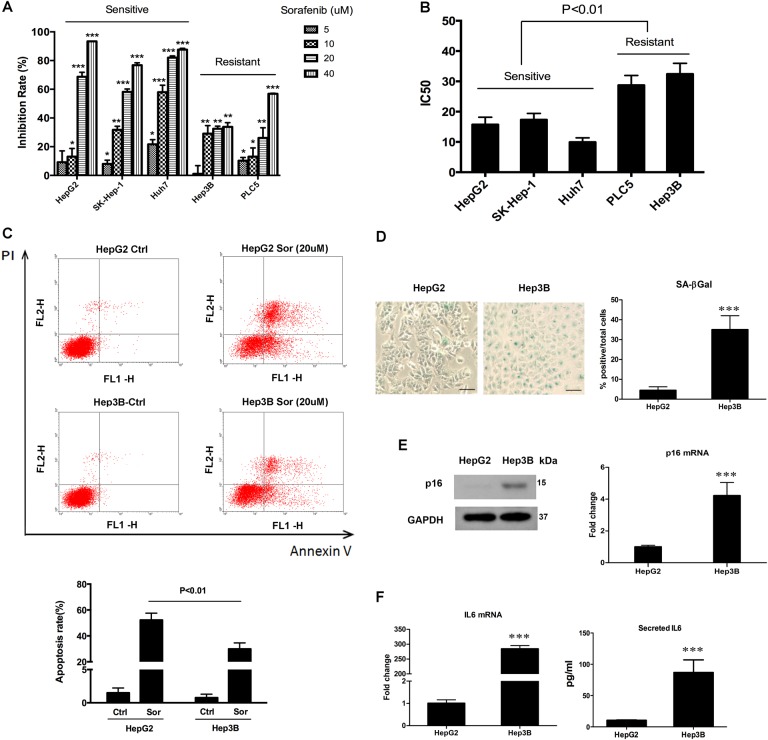
Fig. 1. Relationship between sorafenib efficacy and cell senescence.
a The sensitivity of five HCC cell lines to sorafenib was measured by MTT assay. Cells were seeded in 96-well plates. After overnight incubation, cells were treated with different concentrations of sorafenib (5, 10, 20, 40 μM) for 24 h, then MTT assay was performed. DMSO was used as the control. The results were shown as inhibition rate, which indicates the percentage of cell growth inhibition caused by sorafenib treatment. b IC50 value was calculated based on the MTT results. The value represents the drug concentration of inducing 50% growth suppression compared to control cells. c HepG2 and Hep3B cells were incubated with sorafenib for 24 h, cell apoptosis was evaluated through flow cytometry (upper). The apoptosis ratio was calculated as the early apoptosis (lower right quadrant) plus the late apoptosis (upper right quadrant) percentage (lower). d HepG2 and Hep3B cells were incubated with β-gal staining solution. Senescent cells exhibited blue staining (left). Percentages of SA-β-gal positive cells were calculated and exhibited as a histogram (right). e Expression level of p16 in HepG2 and Hep3B cell lines was tested by western blot (left) and qRT-PCR (right). f IL6 expression in HepG2 and Hep3B cell lines was measured by qRT-PCR (left) and ELISA (right). For ELISA experiment, cells were seeded in 6-well plates and cultured for 24 h, then cell supernatants were collected. *p < 0.05; **p < 0.01; ***p < 0.001, compared with relevant controls (Ctrl) or HepG2. The scale bars represent 25 μm. All immunoblots indicate molecular size markers in kDa

