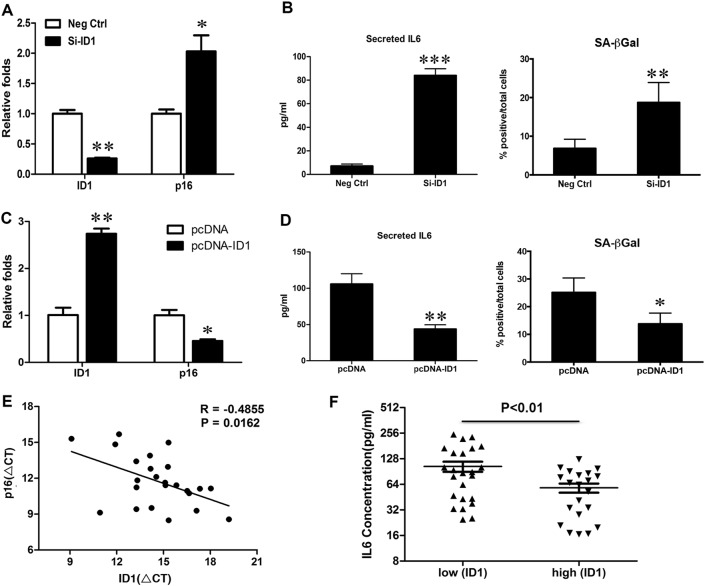
Fig. 3. Negative correlation between ID1 and p16/IL6 axis in HCC.
a, b HepG2 cells transfected with siRNA against ID1 (Si-ID1) for 48 h. a RNA was isolated to detect ID1 and p16 to evaluate knockdown efficiency and its impact on p16 mRNA expression. b IL6 concentrations were quantified by ELISA (left). Percentages of SA-β-gal positive cells were calculated (right). c, d Hep3B cells transfected with pcDNA-ID1 for 24 h. c ID1 overexpression efficiency and its impact on p16 mRNA expression were determined by qRT-PCR. d IL6 concentrations were quantified by ELISA (left). Percentages of SA-β-gal positive cells were calculated (right). e A negative correlation between ID1 and p16 mRNA expression was observed in 24 HCC patient samples. f The levels of IL6, which were measured by ELISA, were higher in HCC patients with low concentrations of ID than those with high ones. *p < 0.05; **p < 0.01; ***p < 0.001, compared with relevant controls (Ctrl) or empty pcDNA

