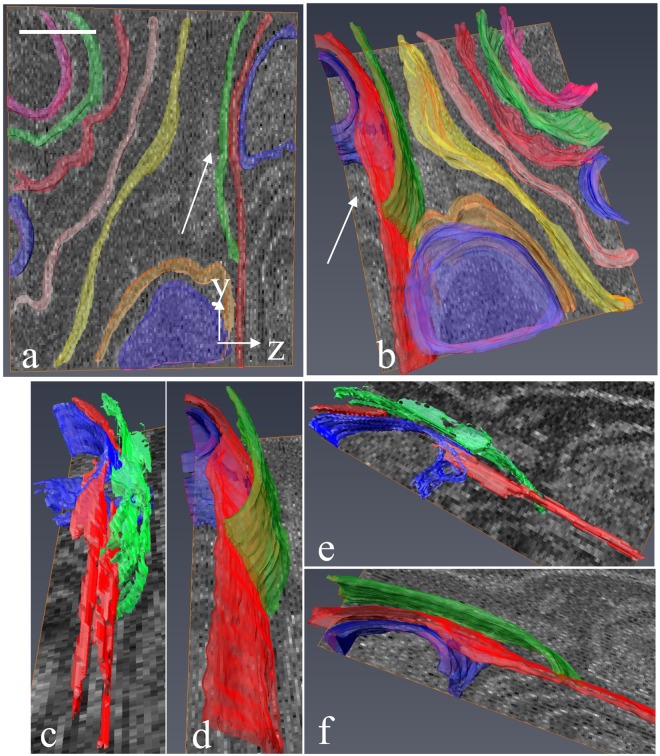
Figure 6.
3D rendered membranes with and without sub-slice reconstruction. (a,b) Views of region of hepatocyte in the y-z orthoslices of Fig. 5(d,f) show clear separation of membranes after sub-slice reconstruction. (c,e) Views of three membranes indicated by arrow in (a,b) obtained from the averaged image stacks acquired at beam energies of 1.0 keV and 1.4 keV, i.e., without sub-slice reconstruction, showing that it is not possible to segment the green and red membranes accurately due to the limited z-resolution of 25 nm in the individual datasets acquired at each beam energy. (d,f) Same views as in (c,e) but after sub-slice reconstruction, again showing a clear separation of the green and red membranes. Scale bar, 500 nm.

