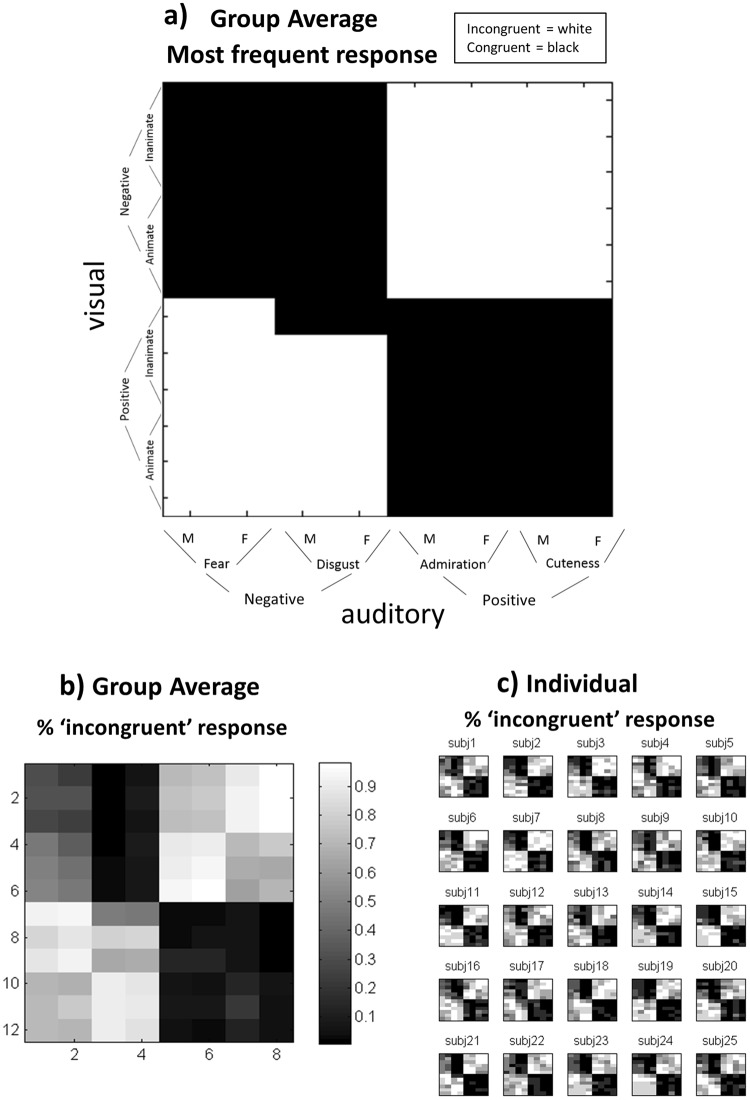
Figure 1.
Behavioral responses during the scanner. Both for visual and auditory domains, half of the stimuli presented a positive valence and the other half a negative valence. (a) Most frequent binary (congruent vs incongruent) response per Audio-Visual (A-V) stimuli combination (8 audio X 12 visual = 96) across the six runs, at the group level, representing thus the ‘shared social norm’ among participants. (b) % of ‘incongruent’ responses, at the group level. (c) % of ‘incongruent’ responses at the individual level.

