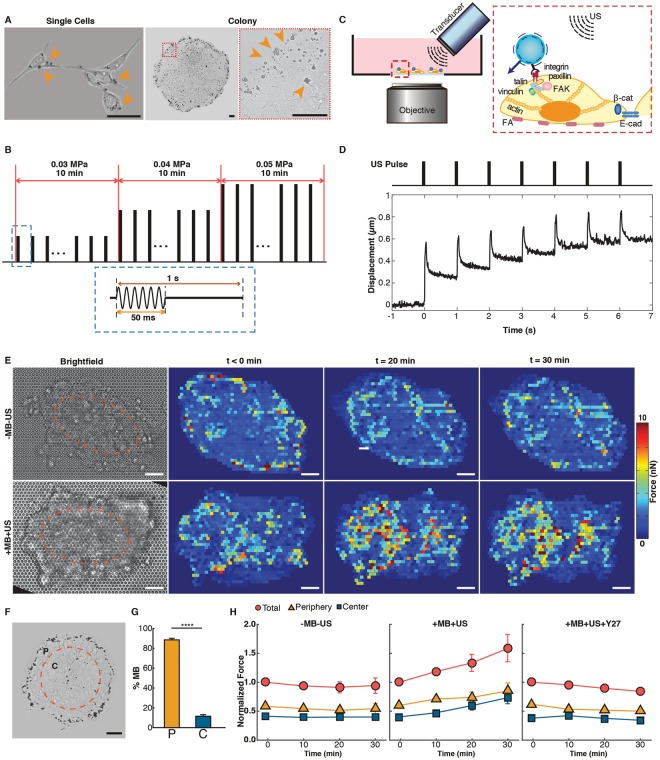
Figure 1.
ATC application using ultrasound (US) excitation of integrin-anchored microbubbles (MBs) and increased cellular contractile forces of hESCs. (A) Bright field images of single hESCs and colony with integrin-bound MBs (arrow heads). Scale bar 40 µm. (B) US pulses used in ATC. (C) Experimental setup for ATC. (D) Cyclic MB displacement vs. time subjected to pulsed US application during ATC application. (E) Bright field images of hESCs seeded on PDMS micropost force sensor array and subcellular contractile force distributions in control hESC colony (-MB-US) (top) and hESC colony treated by ATC (+MB +US) (bottom) at t = 0, 20 and 30 min. ATC was applied at t = 0 for 30 min. ‘P’ denotes periphery zone and ‘C’ central zone. Scale bar 20 µm. (F) Bright field image showing distribution of MBs attached to hESCs in a colony. Colony area is divided into two equal regions marked by the orange circle: periphery (P) (outer 30% radius) and central zone (C) (center 70% radius). (G) Percentage of MBs attached to hESCs in colonies (n = 7) in the periphery (P, 88.53% ± 1.63%) and in the center (C, 11.47% ± 1.63%) (Mean ± SEM). **** denotes p < 0.0001. (H) Normalized contractile force in the entire colony, in the periphery zone, and in the center zone vs. time for control (-MB-US), ATC-treated (+MB +US), and Y27632 (Y27) (10 µM) treated hESC colonies (Mean ± SEM, n = 10).

