
FIGURE 6.
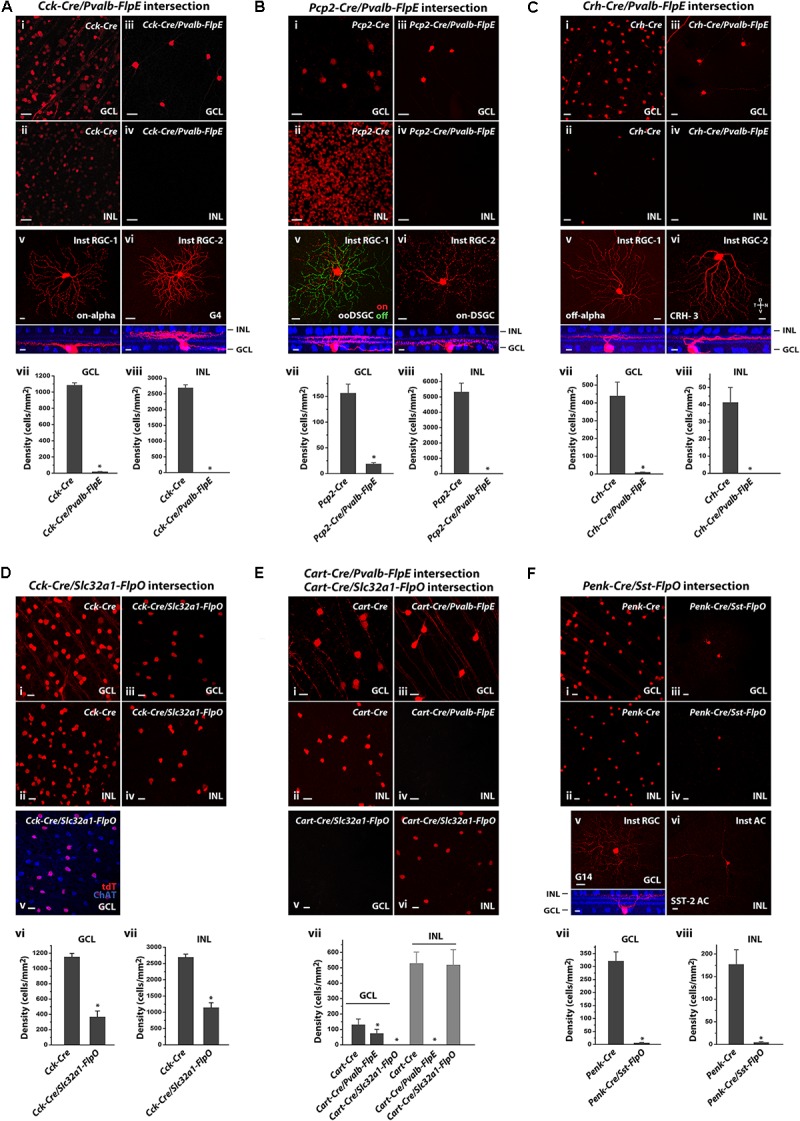
Intersectional strategies to restrict labeling of retinal cell subpopulations. (A) Cck-Cre driver alone and in intersection with the Pvalb-FlpE driver. (i,ii) Distribution of tdTomato-labeled cells in the GCL (i) and the INL (ii) in the Cck-Cre driver crossed with the Ai9 reporter line. (iii,iv) Distribution of tdTomato-labeled cells from the Cck-Cre;Pvalb-FlpE;Ai65 intersection. (v,vi) Examples of individual cell types within the Cck/Pvalb intersection. Flat-mount view (top) and side view (bottom) with ChAT (blue). (vii,viii) Cell labeling density in the Cck-Cre and the Cck-Cre/Pvalb-FlpE intersection for the GCL (vii) or the INL (viii). n = 6 retinas from 6 animals (4 litters) for the Cck-Cre;Ai9. n = 6 retinas from 6 animals (5 litters) for the Cck-Cre;Pvalb-FlpE;Ai65. ∗p < 0.05, two-tailed t-test. (B) Pcp2-Cre driver alone and in intersection with the Pvalb-FlpE driver. (i,ii) labeling of Pcp2-Cre mice by crossing with the Ai9 reporter. (iii,iv) Intersection of Pcp2-Cre and Pvalb-FlpE in the Ai65 reporter. (v,vi) Flat mount views (top) and side views (bottom) of the cell types within the Pcp2/Pvalb intersection. (vii,viii) Cell labeling density in the Pcp2-Cre and the Pcp2-Cre/Pvalb-FlpE intersection for the GCL (vii) or the INL (viii). n = 6 retinas from 6 animals (4 litters) for the Pcp2-Cre;Ai9. n = 6 retinas from 6 animals (6 litters) for the Pcp2-Cre;Pvalb-FlpE;Ai65. ∗p < 0.05, two-tailed t-test. (C) Crh-Cre driver alone and in intersection with the Pvalb-FlpE driver. (i,ii) Crh-Cre driver expression as reported by Ai9 mice. (iii,iv) Intersection of Crh-Cre and Pvalb-FlpE in the Ai65 reporter. (v,vi) Example images of flat mount views (top) and side views (bottom) of the cells within the Crh/Pvalb intersection. (vii,viii) Comparing cell labeling density in the Crh-Cre and the Crh-Cre/Pvalb-FlpE intersection for the GCL (vii) or the INL (viii). n = 7 retinas from 7 animals (5 litters) for the Crh-Cre;Ai9. n = 7 retinas from 7 animals (5 litters) for the Crh-Cre;Pvalb-FlpE;Ai65. ∗p < 0.05, two-tailed t-test. (D) Cck-Cre driver alone and Cck-Cre/Slc32a1-FlpO intersection. (i,ii) Cck-Cre driver crossed with the Ai9 reporter. (iii,iv) Intersection of Cck-Cre and Slc32a1-FlpO reported in Ai65 mice. (v) Cck-Cre/Slc32a1-FlpO intersection (red) in the GCL counter-stained with an antibody against ChAT (blue). (vi,vii) Cell labeling density in the Cck-Cre and the Cck-Cre/Slc32a1-FlpO intersection for the GCL (vi) or the INL (vii). n = 6 retinas from 6 animals (5 litters) for the Cck-Cre;Ai9. n = 6 retinas from 6 animals (5 litters) for the Cck-Cre;Slc32a1-FlpO;Ai65. ∗p < 0.05, two-tailed t-test. (E) Cart-Cre driver alone and in intersection with Pvalb-FlpE or Slc32a1-FlpO. (i,ii) Cart-Cre driver with Ai9 reporter. (iii,iv) Cart-Cre/Pvalb-FlpE intersection removed labeling from amacrine cells. (v,vi) Cart-Cre/Slc32a1-FlpO intersection removed labeling from RGCs. (vii) Cell labeling density in Cart-Cre alone, Cart-Cre/Pvalb-FlpE intersection, and Cart-Cre/Slc32a1-FlpO intersection for the GCL (dark gray) or the INL (gray). n = 8 retinas from 8 animals (5 litters) for the Cart-Cre;Ai9. n = 8 retinas from 8 animals (6 litters) for the Cart-Cre;Pvalb-FlpE;Ai65. n = 8 retinas from 8 animals (6 litters) for the Cart-Cre;Slc32a1-FlpO;Ai65. ∗p < 0.05, two-tailed t-test. (F) Penk-Cre driver alone and Penk-Cre /Sst-FlpO intersection. (i,ii) Penk-Cre driver with Ai9 reporter. (iii,iv) Intersection of Penk-Cre and Sst-FlpO in the Ai65 reporter. (v,vi) Example images of individual cell types within the Penk/Sst intersection. Flat-mount view (top) and side view (bottom) with ChAT (blue). (vii,viii) Cell labeling density in the Penk-Cre and the Penk/Sst intersection for the GCL (vii) or the INL (viii). n = 7 retinas from 7 animals (5 litters) for the Penk-Cre;Ai9. n = 7 retinas from 7 animals (5 litters) for the Penk-Cre;Sst-FlpO;Ai65.∗p < 0.05, two-tailed t-test. Scale bar, 20 μm for flat-mount view, 10 μm for side view.