
FIGURE 7.
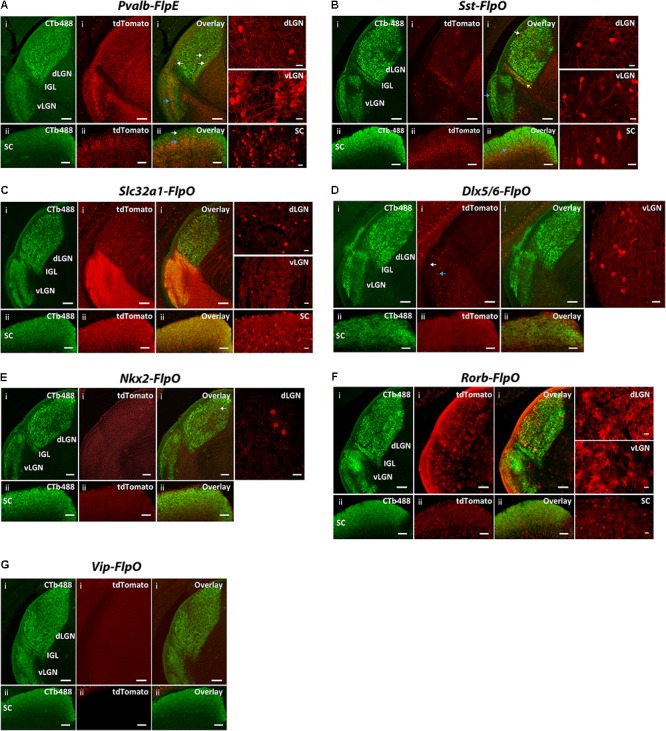
Expression patterns of Flp drivers in the SC and the LGN. FLP-expressing cells were labeled with tdTomato (red) in CMV-Cre;Flp;Ai65 mice. Retino-recipient zones were labeled with cholera toxin B conjugated to Alexa Fluor 488 (CTb-488) (green) injected to the eyes. (A) Pvalb-FlpE driver. In the SC, FLPe strongly expressed in the deep layer (ii, blue arrow) but sparsely expressed in the superficial layer (ii, white arrow). The middle layer of vLGN also strongly expressed FLPe (i, blue arrow). The dLGN showed very sparse labeling (i, white arrows). Intense tdTomato background comes from axons of FLPe+ RGCs. (B) Sst-FlpO driver. Strong FLPo expression was found in the deep layer of the SC (ii, blue arrow). Only sparse labeling was found in the vLGN and dLGN, while most of the labeled cells were in the superficial layer (i, white arrow for dLGN, blue arrow for vLGN). There was also moderate labeling in IGL (yellow arrow). (C) Slc32a1-FlpO targeted FLPo expression broadly to all the layers in the LGN and SC. (D) Dlx5/6-FlpO driver. FLPo expression was sparse and restricted primarily to the superficial (i, white arrow) and middle layer of the vLGN (i, blue arrow). No FLPo labeling was found in SC and dLGN. (E) Nkx2-FlpO driver. In the dLGN, sparely labeled cells were found in the core region (i, arrow). There was no labeling in other areas. (F) Rorb-FlpO driver. FLPo expression was observed in neurons in all layers in the SC (ii), as well as glial cells in the entire LGN including both the dLGN and the vLGN (i). (G) Vip-FlpO driver did not express in either the LGN or the SC. For each driver, examples of enlarged labeling area are shown on the right. Scale bar: 100 μm for the LGN, 50 μm for the SC, 20 μm for the enlarged regions.