Figure 3.
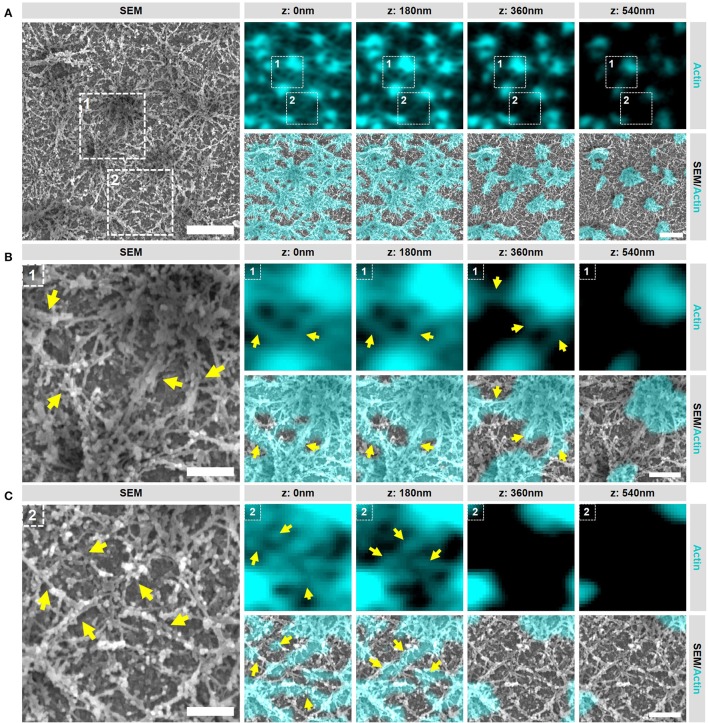
Podosome clusters contain different types of actin filaments. (A) DCs were seeded on glass coverslips and after VPM preparation, cells were fixed and stained for actin (cyan). After CPD, DCs were imaged by SEM (gray). Shown is a representative area within a cluster showing the podosome cores and the dense actin network. Scale bar = 1 μm. (B) Zoom area number 1 from panel (A). Shown is a representative area that primarily contains actin filaments that are directly associated to podosome cores (indicated by the arrows). Scale bar = 400 nm. (C) Zoom area number 2 from panel (A). Shown is a representative area that primarily contains actin filaments that are not directly associated to podosome cores (indicated by the arrows). Scale bar = 400 nm.

