
FIGURE 3.
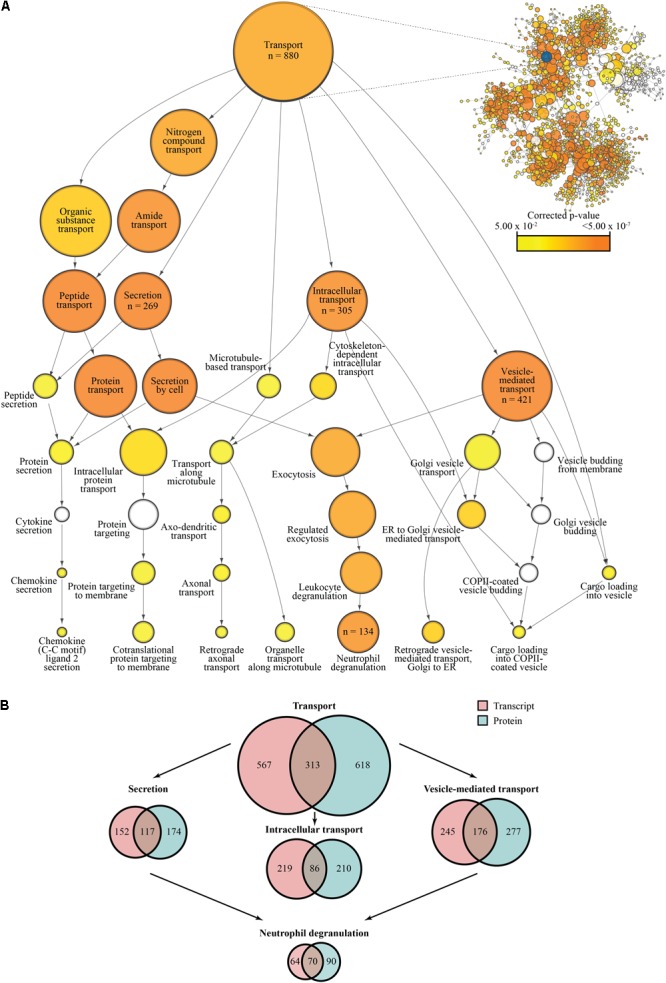
Gene ontology-based analysis of transcriptional and proteomic regulation during HCMV infection. (A) Network map of overrepresented GO terms following significance filtration of the transcriptional dataset. The “Transport” node and its descendant nodes have been enlarged to better visualize relevant processes. Descendant nodes are terms nested within a given parent node; relationships between parent nodes and descendant nodes are indicated by directional arrows representing the shift from general to more specific classifiers. Genes are classified based on the deepest level of annotation available and node areas are proportional to the number of genes classified by each term with some genes being classified by more than one term at a given level in the hierarchy; specific values have been listed for nodes of interest. Reported p-values are Benjamini–Hochberg corrected (α = 0.05); uncolored nodes were not significantly overrepresented. A comparable network map based on overrepresentation of GO annotations in the filtered proteomics dataset may be found in Supplementary Figure S1. (B) Comparison of gene annotation between the transcriptional and proteomic datasets. Values represent the number of overrepresented genes per term.