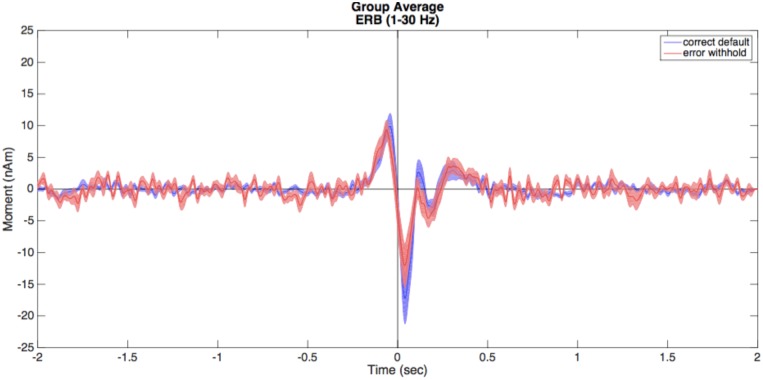
FIGURE 5.
Virtual sensors (VS). Illustrated here are the averaged VS plots calculated from the ERB peak of each condition. Correct default (in blue) and error withhold (in red) plots are displayed with shaded standard error bars using BrainWave tools, then edited to a single plot using Matlab’s figure editing tools (e.g., overlay, add legend, text size, etc.).

