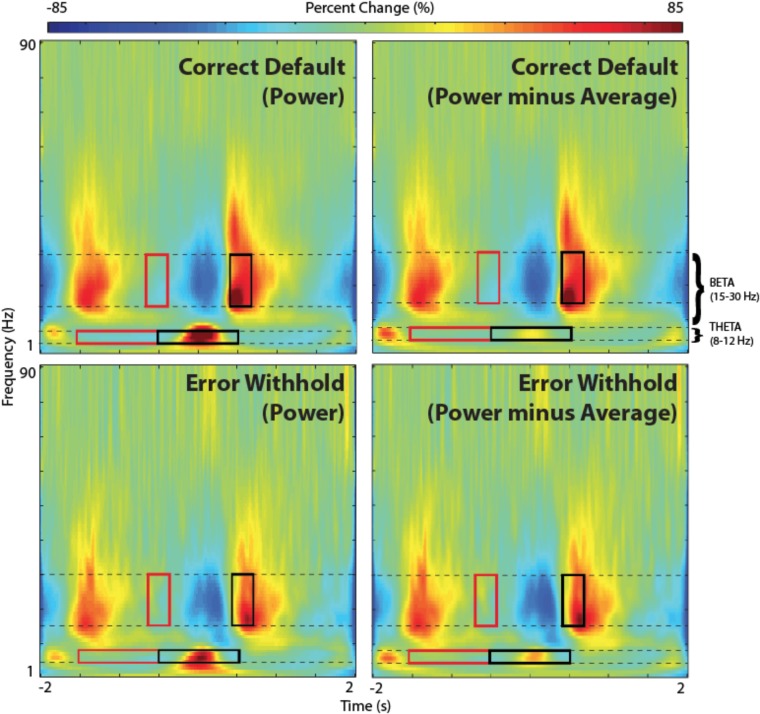
FIGURE 6.
Time-frequency representations (TFR). TFR plots are useful as an aid in the identification of appropriate baseline and active windows for SAM beamformer analyses. Here, we demonstrate the chosen baseline window (red) and active window (black) within the beta band frequency (15–30 Hz), as well as suggested windows for theta band frequency (4–8 Hz), for a group SAM motor peak analyses. Time zero indicates button press. Note that removing the averaged evoked activity (power-average dropdown option within BrainWave) shows only non-phase locked activity, resulting in reduced power in both beta and theta bands. However, larger reductions are found in theta and remains higher in the error condition.

