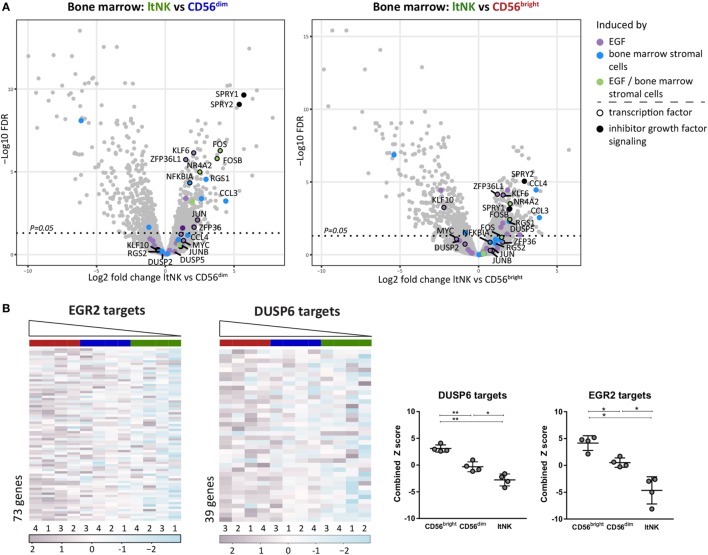
Figure 5.
Gene set enrichment analysis (GSEA) reveals potential inducers of ltNK cell transcriptome. (A) The gene sets epidermal growth factor (EGF) signaling (M16311) and bone marrow (BM) stimulation (M5929) were enriched in ltNK cells, as identified by GSEA using CAMERA and the Broad institute gene set collections. The log2 fold change of ltNK versus CD56bright or ltNK versus CD56dim is plotted against the false discovery rate (FDR) in volcanoplots. Genes that were induced by either EGF, BM stromal cells, or both are depicted. SPRY1 and SPRY2 are two inhibitors of growth factor signaling. FDR, false discovery rate. (B) GSEA revealed that targets that are repressed by EGR2 (M12804) or DUSP6 (M7339) are downregulated in ltNK cells. Heatmaps show the normalized expression values of the corresponding genes, which are repressed by EGR2 (n = 73) and DUSP6 (n = 39). The column order is based on the combined Z score of each donor natural killer cell population (high → low). The combined Z score is a quantification of the overall expression level of the target genes. Error bars represent mean ± SD. *P < 0.05, **P < 0.01, by one-way ANOVA.

